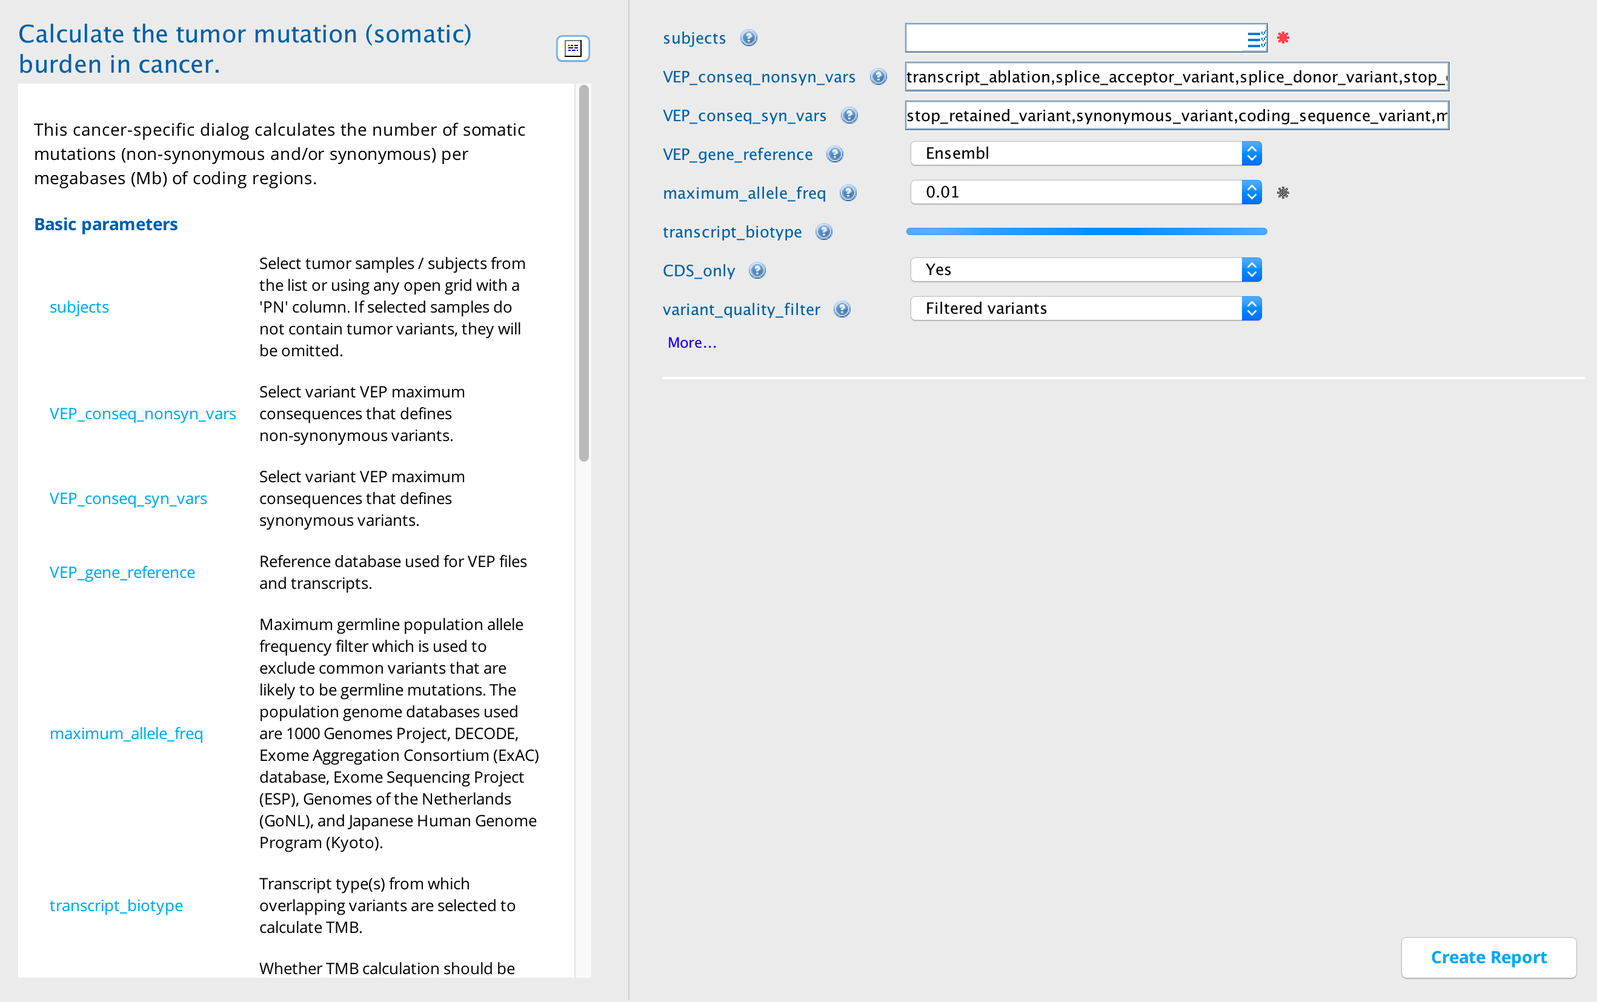
Tumor mutation burden
Tumor mutation burden (TMB) is a measurement of the total number of somatic mutations in a tumor and is usually expressed per megabase (Mb) of the targeted genomic regions (either whole exome or gene-panel). TMB has been identified as an effective biomarker for the responsive of immunotherapy in cancer1-2. Such effectiveness of TMB has been hypothesized since increased mutation rate can lead to an increased number of mutated proteins, or neo-antigens, on the surface of tumor cells which in turn can have a better chance of eliciting an immune response3. TMB is described using the following equation:
TMB = Number of mutations in coding (or targeted) regions / The total size of the coding (or targeted) region (in Mb)
The Tumor mutation burden report builder accepts individual sample names from the various TCGA projects as required inputs. If samples from multiple projects are selected, the outputs are grouped per project wherever appropriate. This analysis calculates the TMB of all the samples included in the specified project(s) or individually selected samples from the corresponding whole exome sequencing (WES) libraries.
The mutations are filtered for 1) sequencing qualities, 2) variant calling qualities, and 3) commonly occurring germline variants before the calculations. TMB values are calculated separately for all variants as well as non-synonymous and synonymous variants.
The output also shows the rank and Z-score of individual samples within the project based on the TMB values of all, non-synonymous, and synonymous variants. A comparison of the TMB values of the samples in various TCGA projects are shown in the table and figure below.
Tumor Mutation Burden in Sequence Miner
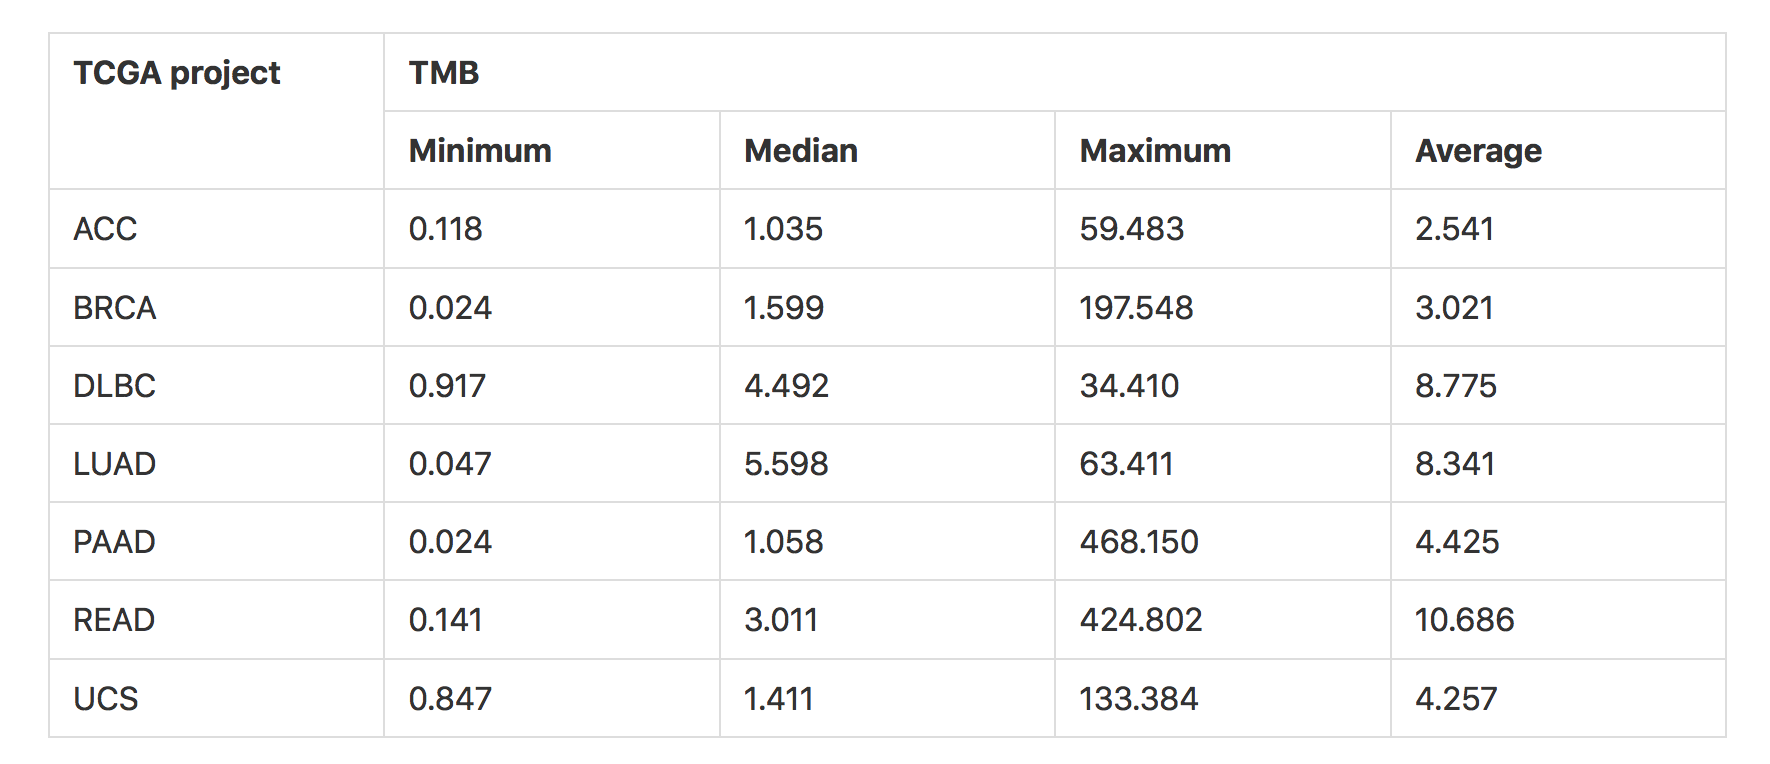
TMB values of samples (using all variants) in various TCGA projects. The reference database chosen here for transcripts is Ensembl (HG38), and the exome capture target region selected is Agilent SureSelect Human All Exon V4 (see figure below). ACC: adrenocortical cancer, BRCA: breast invasive carcinoma, DLBC: diffuse large B-cell lymphoma, LUAD: lung adenocarcinoma, PAAD: pancreatic adenocarcinoma, READ: rectum adenocarcinoma, UCS: uterine carcinosarcoma. For independent comparative analysis of the TMB values refer to Lawrence et al., 20134.
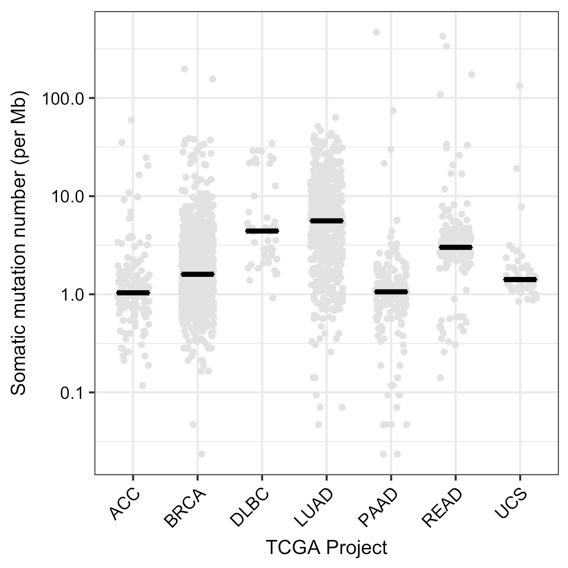
Distribution of the somatic mutation number per megabase (Mb) or TMB using all variants for samples in various TCGA projects. The black line represents the median TMB for the project (see table above). Reference database: Ensembl (HG38), exome capture target region: Agilent SureSelect Human All Exon V4.
Non-synonymous and synonymous variants
The consideration of non-synonymous and synonymous variants as separate groups is an important factor during the calculation of TMB, especially in studies where the correlation of TMB with the effectiveness of immunotherapy is being studied5. This is primarily due to the fact that an increased number of protein sequence-altering non-synonymous variants can lead to an increased number of mutant proteins on the cell surface or neo-antigens. The abundance of neo-antigens increases the possibility of the immune system recognizing the mutant proteins on the cancer cells and mounting an effective response against them, especially in conditions where an immunotherapy is used.
Higher non-synonymous mutations have been shown to positively correlate with response to checkpoint inhibitors in melanoma6 and NSCLC1. As such, TMB of non-synonymous mutations could be used effectively to identify patients who might potentially have a better response to immunotherapy.
The calculation of TMB using all variants in samples can often be misleading because the distribution and values of TMBs of non-synonymous and synonymous variants can be different in samples of any particular cancer type (see figure below). At the same time, the degree of difference of the non-synonymous and synonymous variant TMB can be different across different cancer types (figure below – BRCA vs UCS).
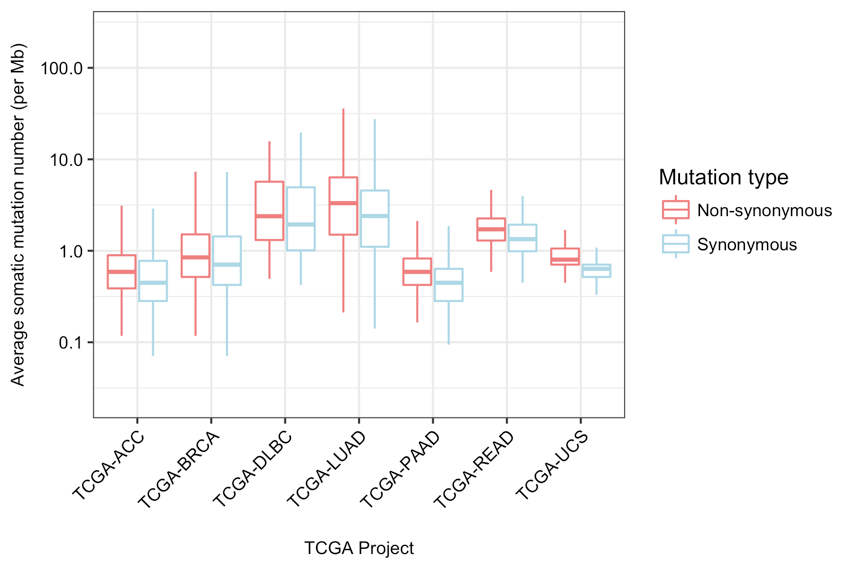
Average somatic mutation number per Mb or TMB of the samples in various TCGA projects using non-synonymous and synonymous variants. Reference database: Ensembl (HG38); exome capture target region: Agilent SureSelect Human All Exon V4.
Example use case
The user/investigator has WGS/WES sequences of about 100 tumor samples of a particular cancer type and is interested in finding out the TMB of individual samples, as well as the mean/median TMB as a group. These results allow the user/investigator to learn valuable information about the samples, including:
Whether there is any sample that tends to have a very high/low number of variants and likewise TMB. Such outliers can be removed from any further analysis.
Whether the mean/median TMB of the group as a whole compares well with the TMB known for that particular cancer type from other sources (like TCGA).
Calculation method
Step 1: The total length of the region from which the variants are selected is determined. The selection of this region is determined by various input parameters (VEPgenes, transcriptBiotype, CDSonly, and captureTargetRegions).
First, exonic regions are selected from either the Ensembl exon file or the RefSeq exon file (determined by the parameter “VEPgenes”).
Next, only the exons that are part of transcripts of chosen biotypes (e.g., protein_coding or antisense_RNA) are retained (determined by the parameter “transcriptBiotype”).
If the parameter “CDSonly” is set as “Yes”, then any region that is not part of the Coding DNA Sequences (CDS) is filtered out. If any exome capture kit is selected in the parameter “captureTargetRegions”, then the retained exonic regions are intersected with the target regions of the selected capture kit and any exonic regions that do not intersect are filtered out.
Finally, any overlapping regions in the remaining exonic regions are collapsed into single regions and the total length of all regions is calculated in megabase (Mb). The choice of the different parameters for target regions can lead to the selection of regions of variable length (see table below), which can in turn give different values for TMB (see figure below) since during the calculation of TMB the total number of mutations in the target region is divided by the length of the target region.
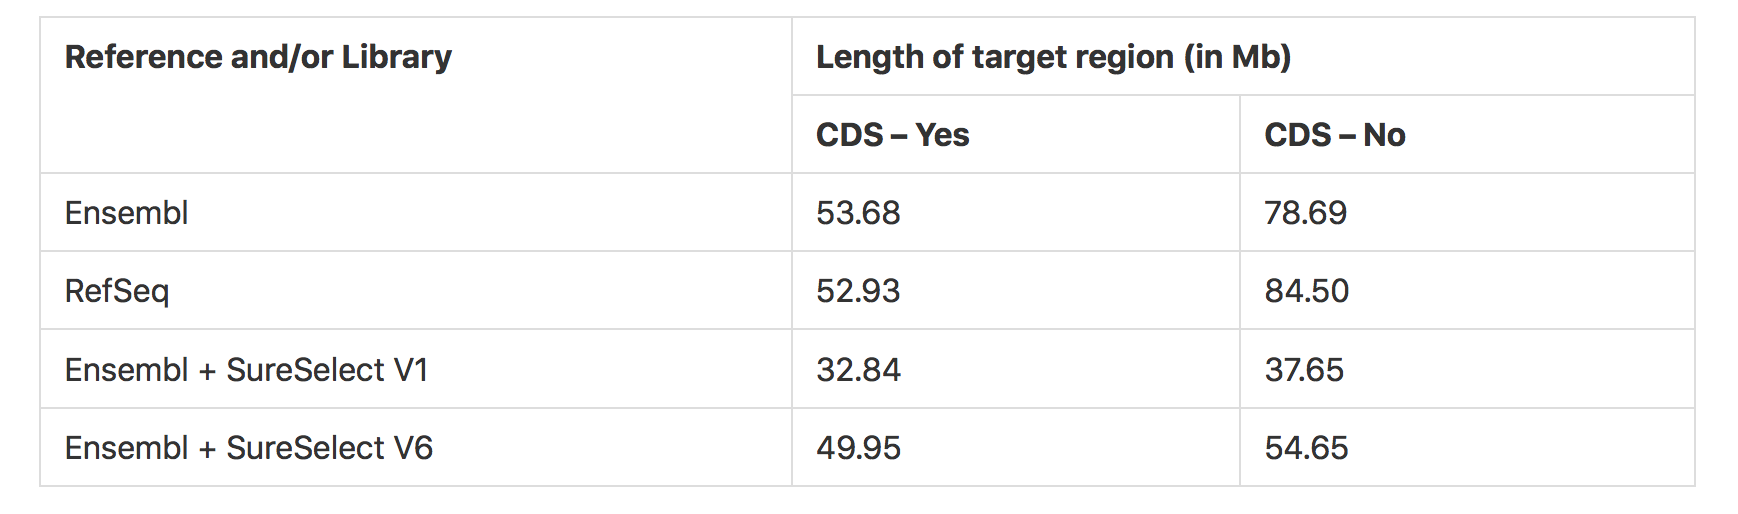
Variation in target region length (in Mb) based on selection of reference annotations and/or exome capture kit regions
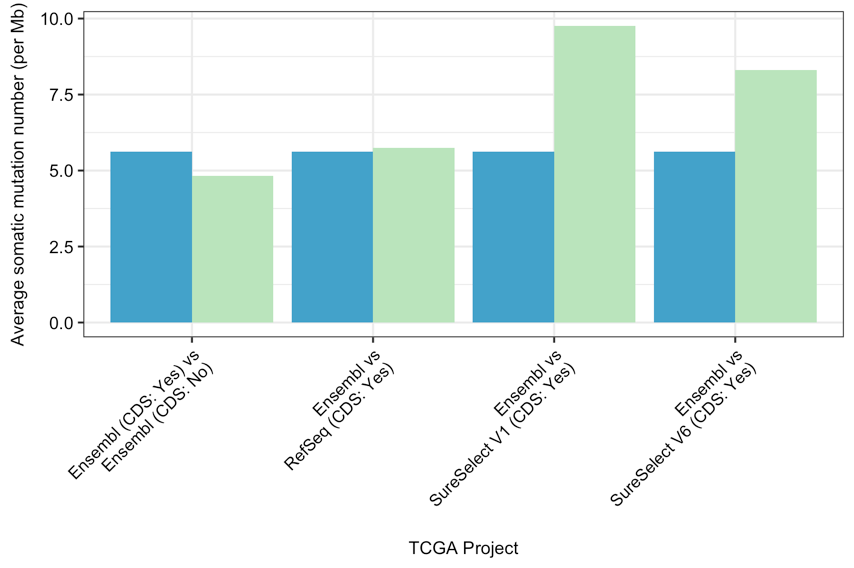
Comparison of average somatic mutation number per Mb or TMB using all variants in TCGA-LUAD project in various target regions. The blue bars represent the first entity of the comparison, while the green bars represent the second (e.g., Ensembl (blue) vs RefSeq (green)); reference database version: HG38.
Step 2: The variants from the selected samples (“PROJECTS” and/or “SUBJECTS”) are filtered based on sequence quality or variant quality using the following criteria:
MuTect2 metrics: MuTect2 judgement is “KEEP”; at least 2 high quality reads are present; those high-quality reads represent at least 1% of the total number of reads for that variant in that sample
VarScan2 metrics: VarScan2 calls the variant as “Somatic”; the p-value for the somatic call is < 0.001
Step 3: The population variants that are not common in COSMIC are filtered out. Known germline variants are filtered out by excluding any variant that is present at a frequency greater than or equal to 1% in the HG38 of any of the following population genome databases: 1000 Genomes Project, DECODE, Exome Aggregation Consortium (ExAC) database, Exome Sequencing Project (ESP), Genomes of the Netherlands (GoNL), and Japanese Human Genome Program (Kyoto). Of these germline variants, any variant that is frequently occurring in the COSMIC database (present in at least a certain number of samples) is retained. The frequency is determined by the parameter “cosmicFilterMin” with the default set at 47.
Step 4: The variants are intersected with the previously selected exonic regions (see step 1) to retain only the ones that are overlapping.
Step 5: The TMB of individual samples using all retained variants is calculated by dividing the total number of variants in the sample by the total length of the selected exonic region in Mb (see step 1). The output columns are variant_count_all and TMB_all.
Step 6: Separate TMBs are also calculated in each sample for the two groups of variants: non-synonymous (“TMB_nonSyn”) and synonymous (“TMB_syn”). The ratios of the counts of both groups to all variant counts are also calculated (“variant_ratio_nonSyn_to_all” and “variant_ratio_syn_to_all”). By default, variants with HIGH and MODERATE VEP impacts are grouped as non-synonymous; variants with LOW and LOWEST VEP impacts are grouped as synonymous. The full list of default “maximum consequences” for the two groups is as follows:
Non-synonymous |
Synonymous |
|---|---|
transcript_ablation |
stop_retained_variant |
splice_acceptor_variant |
synonymous_variant |
splice_donor_variant |
coding_sequence_variant |
stop_gained |
mature_miRNA_variant |
frameshift_variant |
5_prime_UTR_variant |
stop_lost |
3_prime_UTR_variant |
start_lost |
non_coding_transcript_exon_variant |
transcript_amplification |
intron_variant |
inframe_insertion |
NMD_transcript_variant |
inframe_deletion |
non_coding_transcript_variant |
missense_variant |
upstream_gene_variant |
protein_altering_variant |
downstream_gene_variant |
splice_region_variant |
TFBS_ablation |
incomplete_terminal_codon_variant |
TFBS_amplification |
TF_binding_site_variant |
|
regulatory_region_ablation |
|
regulatory_region_amplification |
|
feature_elongation |
|
regulatory_region_variant |
|
feature_truncation |
|
intergenic_variant |
|
regulatory_region_fusion |
|
regulatory_region_translocation |
|
TFBS_fusion |
|
TFBS_translocation |
Step 7: The rank (in descending order) and the z-score of each sample in its specific project is calculated using the TMB for all variants (“TMB_all”), non-synonymous variants (“TMB_nonSyn”), and synonymous variants (“TMB_syn”). The output columns are as follows:
rank_TMB_all
Zscore_TMB_all
rank_TMB_nonSyn
Zscore_TMB_nonSyn
rank_TMB_syn
Zscore_TMB_syn
Interpreting the output
Column descriptions
Group |
Column |
Description |
|---|---|---|
Basic |
PN |
Sample/subject name, selected individually or as part of a TCGA project as input |
Variant |
variant_count_all |
Number of all mutations in that are present within the regions specified the transcript region parameters (VEPgenes, transcriptBiotype, CDSonly) and the target region parameter (captureTargetRegions) |
variant_count_nonSyn |
Number of non-synonymous variants among all variants as described above in variant_count_all |
|
variant_count_syn |
Number of synonymous variants among all variants as described above in variant_count_all |
|
TMB |
TMB_all |
The TMB of the variants in variant_count_all |
TMB_nonSyn |
The TMB of the variants in variant_count_nonSyn |
|
TMB_syn |
The TMB of the variants in variant_count_syn |
|
rank |
rank_TMB_all |
Rank of the sample within the corresponding project, based on the TMBs of all variants (TMB_all); the sample with the highest TMB is ranked #1 |
rank_TMB_nonSyn |
Rank of the sample within the corresponding project, based on the TMBs of non-synonymous variants (TMB_nonSyn); the sample with the highest TMB is ranked #1 |
|
rank_TMB_syn |
Rank of the sample within the corresponding project based on the TMBs of synonymous variants (TMB_syn); the sample with the highest TMB is ranked #1 |
|
Other columns |
TCGA_project |
TCGA project name of the sample/subject |
Perspective views
The Default view perspective displays all samples/subjects. Additional perspectives focus on subsets of the columns in the default view.
Perspective |
Description |
|---|---|
Default view |
Displays all samples/subjects |
High TMB samples (All) |
Displays only samples/subjects that have high TMB calculated using all variants (TMB_all); TMBs greater than (>) the input variable “tmbMediumCutoffMax” are considered High |
High TMB samples (Non-synonymous) |
Displays only samples/subjects that have high TMB calculated using only non-synonymous variants (TMB_nonSyn); TMBs greater than (>) the input variable “tmbMediumCutoffMax” are considered High |
High TMB samples (Synonymous) |
Displays only samples/subjects that have high TMB calculated using only synonymous variants (TMB_syn); TMBs greater than (>) the input variable “tmbMediumCutoffMax” are considered High |
Low TMB samples (All) |
Displays only samples/subjects that have low TMB calculated using all variants (TMB_all); TMBs less than or equal to (<=) the input variable “tmbLowCutoffMax” are considered Low |
Low TMB samples (Non-synonymous) |
Displays only samples/subjects that have low TMB calculated using only non-synonymous variants (TMB_nonSyn); TMBs less than or equal to (<=) the input variable “tmbLowCutoffMax” are considered Low |
Low TMB samples (Synonymous) |
Displays only samples/subjects that have low TMB calculated using only synonymous variants (TMB_syn); TMBs less than or equal to (<=) the input variable “tmbLowCutoffMax” are considered Low |
Medium TMB samples (All) |
Displays only samples/subjects that have medium TMB calculated using all variants (TMB_all); TMBs less than or equal to (<=) the input variable “tmbMediumCutoffMax” and greater (>) than “tmbLowCutoffMax” are considered Medium |
MediumTMB samples (Non-synonymous) |
Displays only samples/subjects that have medium TMB calculated using only non-synonymous variants (TMB_nonSyn); TMBs less than or equal to (<=) the input variable “tmbMediumCutoffMax” and greater (>) than “tmbLowCutoffMax” are considered Medium |
MediumTMB samples (Synonymous) |
Displays only samples/subjects that have medium TMB calculated using only synonymous variants (TMB_syn). TMBs less than or equal to (<=) the input variable “tmbMediumCutoffMax” and greater (>) than “tmbLowCutoffMax” are considered Medium |
Drill-in reports
Drill-in |
Description |
|---|---|
Project level statistics (All) |
This drill-in report calculates the project-level statistics of the selected samples using the TMB of all variants (TMB_all); the output includes minimum, median, maximum, and average TMB for each project of the selected samples. |
Project level statistics (Non-synonymous) |
This drill-in report calculates the project-level statistics of the selected samples using the TMB of non-synonymous variants (TMB_nonSyn); the output includes minimum, median, maximum, and average TMB for each project of the selected samples. |
Project level statistics (Synonymous) |
This drill-in report calculates the project-level statistics of the selected samples using the TMB of synonymous variants (TMB_syn); the output includes minimum, median, maximum, and average TMB for each project of the selected samples. |
References
Rizvi NA, Hellmann MD, Snyder A, et al. Mutational landscape determines sensitivity to PD-1 blockade in non-small cell lung cancer. Science. 2015;348 (6230):124-128.
van Allen EM, Miao D, Schilling B, et al. Genomic correlates of response to CTLA-4 blockade in metastatic melanoma. Science. 2015;350(6257):207-211.
Chalmers ZR, Connelly CF, Fabrizio D, et al. Analysis of 100,000 human cancer genomes reveals the landscape of tumor mutational burden. Genome Med. 2017;9:34.
Lawrence MS, Stojanov P, Polak P, et al. Mutational heterogeneity in cancer and the search for new cancer-associated genes. Nature. 2013; 499(7457):214-218.
Colli LM, Machiela MJ, Myers TA, et al. Burden of Nonsynonymous Mutations among TCGA Cancers and Candidate Immune Checkpoint Inhibitor Responses. Cancer Res. 2016; 76(13):3767-3772.
Snyder A, Makarov V, Merghoub T, et al. Genetic basis for clinical response to CTLA-4 blockade in melanoma. N Engl J Med 2014;371:2189–2199.
Analysis of Tumor Mutational Burden with TruSight® Tumor 170. https://www.illumina.com/content/dam/illumina-marketing/documents/products/whitepapers/trusight-tumor-170-tmb-analysis-white-paper-1170-2017-001.pdf