Methylation summary
The Methylation summary report builder provides the methylation status of supplied samples at the individual probe level, gene level, or transcript level, depending on the input selection. For gene- and transcript-level output, the methylation values of all the probes within or around the gene or transcript are grouped together and interpreted accordingly.
The report builder also provides information about the TCGA project and the availability of other data types (e.g., WES, CNV, miRNA, and methylation) for the same individual.
The methylation value of individual probes is represented as a beta value which represents the ratio between the methylated array intensity and the total array intensity 1. The beta value falls between 0 (lower levels of methylation) and 1 (higher levels of methylation).
Each probe is assigned to a nearby gene and transcript when the probe is located 1,500 bp upstream of the transcription start site (TSS) to the end of the gene body. Such gene-related information is extracted from Infinium HumanMethylation27 and HumanMethylation450K BeadChip annotation tables, which have been obtained from the manufacturer’s website 2 , 3 for the hg19 version and from the Genomic Data Commons 1 for the hg38 version. Each probe is also assigned to a relative position in a CpG Island (CGI) if it is near one Island, N_Shore, or S_Shore (0-2 kb upstream or downstream from the CGI), or near one N_Shelf or S_Shelf (2-4 kbp upstream or downstream from the CGI).
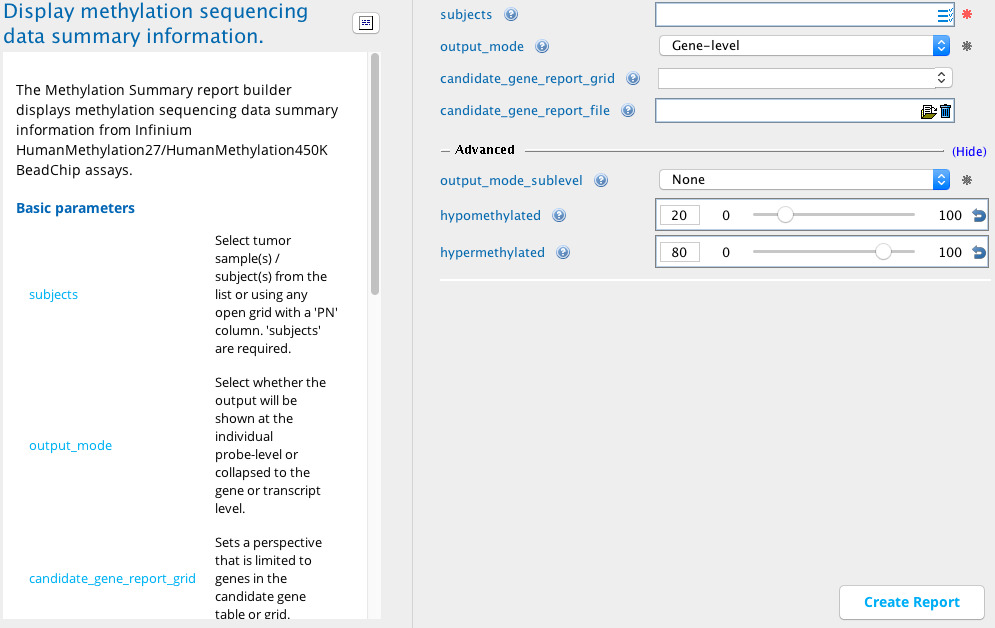
Methylation summary module in Sequence Miner
Example use case
A user is interested in knowing the methylation pattern of the genes in a sample or group of samples. Using this report builder, it is possible to identify genes that are less methylated (hypomethylated) at the promoter and likewise possibly transcriptionally active, as well as genes that are more methylated (hypermethylated) and likewise possibly transcriptionally silent.
Interpreting the output
Output columns can be viewed in different Perspectives (see also Column descriptions).
The Default view perspective shows the methylation value of each gene, transcript, and probe per supplied sample, whereas the Candidate genes perspective shows only the genes provided in the candidate_gene_report_grid or candidate_gene_report_file input fields.
The gene- and transcript-level output also shows a list of methylation values of all the probes within them, as well as the minimum and maximum values. The Hypomethylated and Hypermethylated perspectives filter the methylated values of individual probes, genes, or transcripts to show only the less methylated or highly methylated values respectively. For the probe-level output, the filter is applied to the Beta_value_tumor column in both perspectives. For the gene- and transcript-level output, the filter is applied to the min_Beta_value_tumor column in the Hypomethylated perspective and on the max_Beta_value_tumor column in the Hypermethylated perspective. The cutoffs for these filters can be defined in the hypomethylated and hypermethylated input fields in Advanced parameters. Default values for these parameters are 20 (0.2) and 80 (0.8) respectively.
If available, methylation values are displayed for both the tumor sample and its matching normal sample. A fold change in the methylation at the probe-level in the tumor sample is calculated relative to the normal sample. A positive value indicates higher methylation in the tumor and vice versa. This value can provide insight about the transcription status of a gene if the probe is located in the promoter of the gene.
The PN and Flag columns in the output can provide insight about the presence of other data types that are available for both the tumor sample and matching normal sample, which can be useful for a multi-omic study.
Column descriptions
Group |
Column |
Description |
|---|---|---|
Beta |
value_normal |
The beta value of the individual probe or the list of beta values of the probes within the gene/transcript in the tumor sample’s matching normal sample |
value_tumor |
The beta value of the individual probe or the list of beta values of the probes within the gene/transcript in the tumor sample |
|
value_log2_fold_change |
The log2 fold change in beta value in tumor relative to normal; a positive values indicates higher methylation in tumor and vice versa; the formula for calculation is log2(beta value in tumor/beta value in normal); this column is shown only when Probe-level is selected as the output_mode |
|
Flag |
CNV_normal |
A logical value (true/false) indicating whether the CNV data of the matching normal sample is available for the same tumor sample |
CNV_tumor |
A logical value (true/false) indicating whether the CNV data of the same tumor sample is available |
|
Methyl_normal |
A logical value (true/false) indicating whether the methylation sequencing data of the matching normal sample is available for the same tumor sample000 |
|
Methyl_tumor |
A logical value (true/false) indicating whether the miRNA sequencing data of the matching normal sample is available for the same tumor sample |
|
miRNA_tumor |
A logical value (true/false) indicating whether the miRNA sequencing data of the same tumor sample is available |
|
RNASeq_normal |
A logical value (true/false) indicating whether the mRNA sequencing data of the matching normal sample is available for the same tumor sample |
|
RNASeq_tumor |
A logical value (true/false) indicating whether the mRNA sequencing data of the same tumor sample is available |
|
WES |
A logical value (true/false) indicating whether the WES data of the same tumor sample is available |
|
max |
These columns are shown only when Gene-level or Transcript-level is selected as the output_mode. |
|
Beta_value_normal |
The maximum beta value among all of the probes within the gene/transcript in the tumor sample’s matching normal sample |
|
Beta_value_tumor |
Th maximum beta value among all of the probes within the gene/transcript in the tumor sample |
|
min |
These columns are shown only when Gene-level or Transcript-level is selected as the output_mode. |
|
Beta_value_normal |
The minimum beta value among all of the probes within the gene/transcript in the tumor sample’s matching normal sample |
|
Beta_value_tumor |
Th minimum beta value among all of the probes within the gene/transcript in the tumor sample |
|
PN |
CNV_normal |
The sample name/ID of the CNV data of the tumor sample’s matching normal sample |
CNV_tumor |
The sample name/ID of the CNV data of the same tumor sample |
|
Methyl_normal |
The sample name/ID of the methylation sequencing data of the tumor sample’s matching normal sample |
|
Methyl_tumor |
The sample name/ID of the methylation sequencing data of the same tumor sample |
|
miRNA_normal |
The sample name/ID of the miRNA sequencing data of the tumor sample’s matching normal sample |
|
miRNA_tumor |
The sample name/ID of the miRNA sequencing data of the same tumor sample |
|
RNASeq_normal |
The sample name/ID of the mRNA sequencing data of the tumor sample’s matching normal sample |
|
RNASeq_tumor |
The sample name/ID of the mRNA sequencing data of the same tumor sample |
|
WES |
The sample name/ID of the WES data of the same tumor sample |
|
Gene |
Symbol |
The gene for which the probe methylation value(s) are shown |
Type |
The biological type of the gene (protein coding, lincRNA, miRNA, etc.) |
|
Other columns |
candidate_gene |
Binary value (0 or 1) indicating whether the gene is one of the candidate genes selected in either the candidate_gene_report_grid or candidate_gene_report_file fields; 1 indicates “TRUE” and 0 indicates “FALSE” |
probe_count |
The number of probes that are present within the gene/transcript; this column is shown only when Gene-level or Transcript-level is selected as the output_mode |
|
CGI_coordinate |
Genomic coordinates of the CpG Island that the probe is associated with |
|
Composite_Element_REF |
ID (provided by the manufacturer) of the probe |
|
Feature_type |
Position of the probe relative to the CGI |
|
Position_to_TSS |
Position of the probe relative to the transcription start site (TSS) of the nearby gene |
|
Transcript_ID |
Transcript(s) for which the probe methylation value(s) are shown |
|
SubjectID |
The TCGA ID of the individual (TCGA--**) |
|
Disease_type |
The type of cancer |
|
Primary_site |
The primary site or organ of the cancer type |
|
TCGA_project |
A four-letter code for the project of the cancer type |
Perspective views
Perspectives subtabs focus on subsets of the columns in the Default view.
Perspective |
Description |
|---|---|
Candidate genes |
Displays only the genes selected in the candidate_gene_report_grid or candidate_gene_report_file fields |
Default view |
Displays all genes |
Hypermethylated |
Displays probes or genes/transcripts with high methylation values |
Hypomethylated |
Displays probes or genes/transcripts with low methylation values |