Mutational signatures
The collective somatic mutations observed in a cancer are the outcome of multiple mutagenic processes, and each process leaves a characteristic imprint called a mutational signature on the cancer genome [1]. Large-scale sequencing of cancer genomes and exomes have revealed the different types of mutational signatures that are present in various human cancer types. These signatures in cancer genomes reflect the DNA damage and repair processes to which cancer cells and their precursors have been exposed [2]. Some mutational signatures are present in many cancer types, notably a signature attributed to the APOBEC family of cytidine deaminases, whereas others are confined to a single cancer class. Certain signatures are associated with age of the patient at cancer diagnosis, known mutagenic exposures or defects in DNA maintenance, but many are of cryptic origin [3].
Mutational types/signatures are defined by two different aspects of mutation:
Substitution subtype: All substitutions are referred to by the pyrimidine of the mutated Watson–Crick base pair. As a result, six different substitution subtypes are considered: C>A, C>G, C>T, T>A, T>C, and T>G.
Context of the substitution: Each substitution is further defined by the type of bases that are present 5’ and 3’ immediate to the substituted base.
As a result, the combination of the two different aspects defined above can give rise to 96 possible mutation types/signatures – 6 types of substitution X 4 types of 5’ base X 4 types of 3’ base [3].
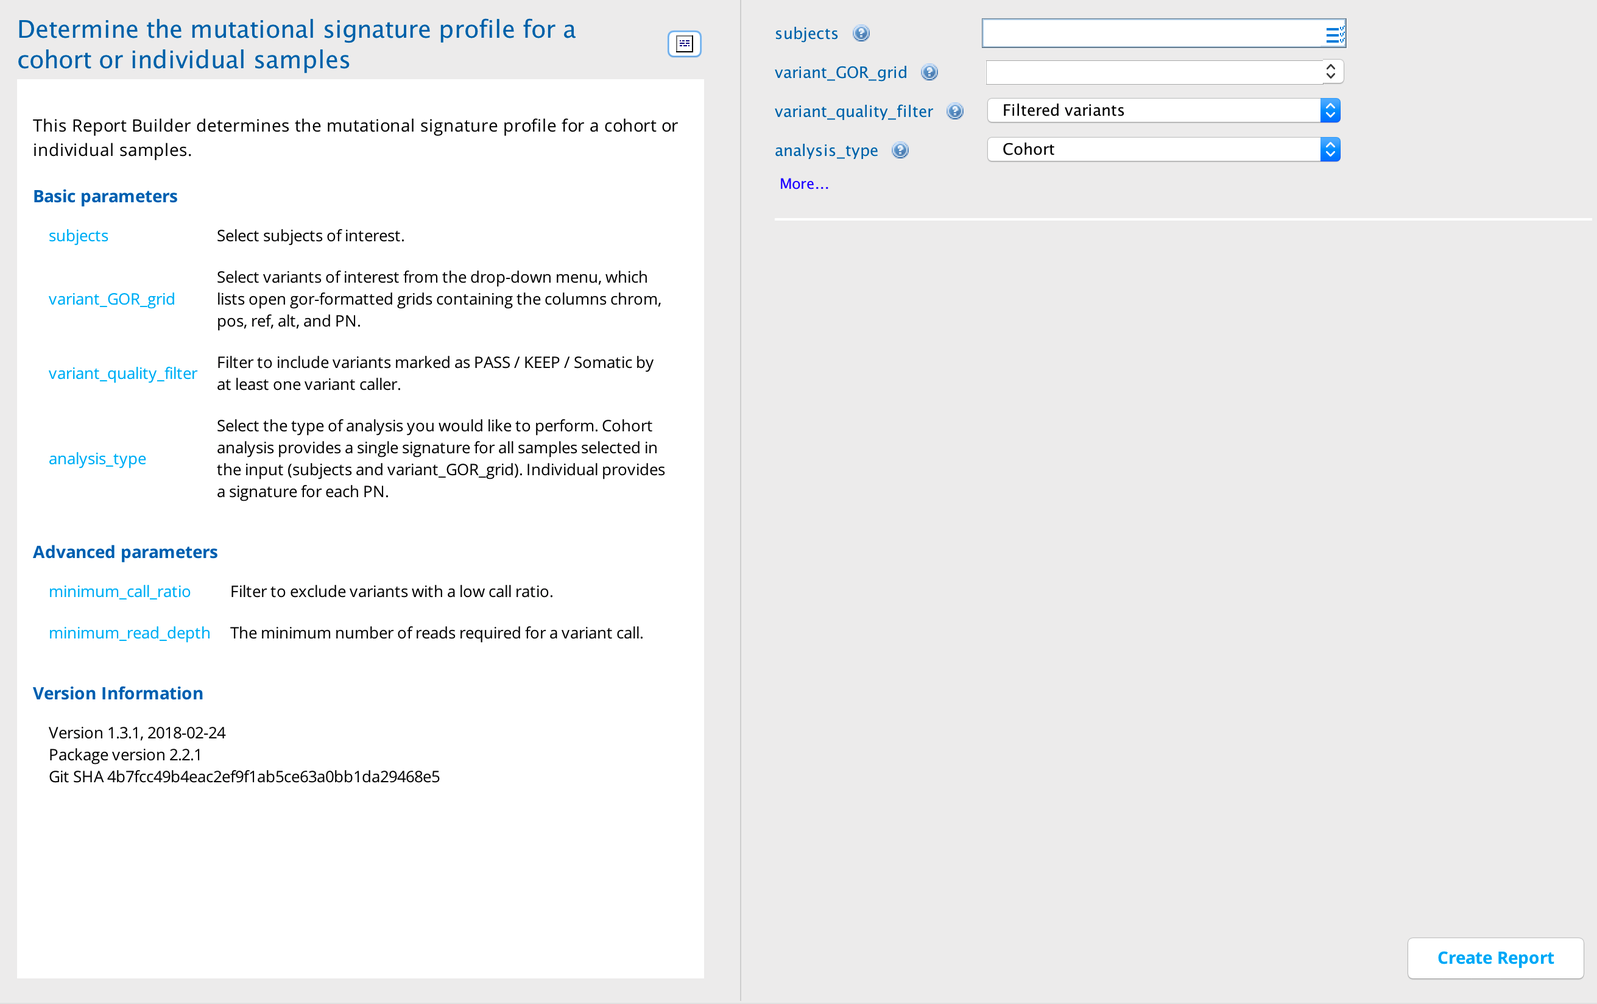
The Mutational signatures report builder calculates the percentages of each of the 96 types of mutational signatures/types in a set of subjects/individuals or in a list of given variants. The Cohort analysis gives the percentage of each type in all the provided subjects/individuals combined. The Individual analysis gives the percentage of each type in each of the provided subjects/individuals separately. The report builder also draws a chart of the percentage of the mutation types/signatures per each substitution type and context (and individual in the case of Individual analysis).
Mutational Signatures in Sequence Miner
Example use case
The user has WGS/WES sequences of about 100 tumor samples of a particular cancer type and is interested in finding out whether one or more particular mutational signature(s) is more prevalent than others in the dataset. Such results can also be further validated, if the mutational signature of that cancer type has been identified from previous studies.
Interpreting the output
Column descriptions
Column |
Description |
|---|---|
Substitution_context_RefSeq |
The trinucleotide context of the mutational signature where the substituted base is in the middle |
Substitution_type |
The substitutions of the signature/mutation type; the signatures are represented using six different subtypes: C>A, C>G, C>T, T>A, T>C, and T>G; all substitutions are referred to by the pyrimidine of the mutated Watson–Crick base pair |
Percent/Percent_in_PN |
The percent of all variants a particular signature is present in; for Cohort analysis this represents the percentage at which the particular signature is present within the entire cohort; for Individual analysis this represents the percentage at which the particular signature is present within the individual only |
PN |
The subject/PN concerned, indicating the individual for the particular mutational signature; this column is included in the output only when “Analysis_type” = “Individual” |
Note
The unique combinations of the context (Substitution_context_RefSeq) and substitutions (Substitution_type) can give rise to a total of 96 mutational signatures (6 types of substitution X 4 types of 5’ base X 4 types of 3’ base).
Output chart
A bar chart displays the percentage of each mutational signature (vertical axis) vs the six different substitution types (horizontal axis). For Cohort analysis, each substitution type is represented by 16 separate bars, one for each possible context. For Individual analysis, each substitution type is represented by (16 X number of subjects) bars, one for each possible context per subject/individual.
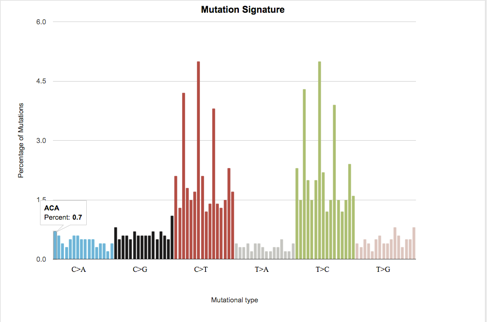
Example of mutational signatures chart for a cohort
References
Helleday T, Eshtad S, Nik-Zainal S. Mechanisms underlying mutational signatures in human cancers. Nat Rev Genet. 2014; 15(9):585-598.
Nik-Zainal S, Alexandrov LB, Wedge DC, et al. Mutational processes molding the genomes of 21 breast cancers. Cell. 2012; 149(5):979-993.
Alexandrov LB, Nik-Zainal S, Wedge DC, et al. Signatures of mutational processes in human cancer. Nature. 2013; 500(7463):415-421.