Differential expression analysis using edgeR
Differential expression analysis using edgeR module in Sequence Miner
Example use case
This report builder allows users to determine differentially expressed genes between two or more groups of samples using the widely used R-based tool edgeR (Empirical Analysis of Digital Gene Expression Data in R) 1 2 3 4 5.
The underlying tool edgeR implements a range of statistical methodologies based on the negative binomial distributions, including empirical Bayes estimation, exact tests, generalized linear models, and quasi-likelihood tests. The supplied input counts are assumed to be those of genes in RNA-seq experiments, but counts can be supplied for any genomic feature of interest, including tags, transcripts, exons, or even arbitrary intervals of the genome. Users can also generate a table of gene-level counts that are normalized based on the sequence library size of the samples, which can be used for cross-sample comparisons of genes and for generating other informative plots such as PCA, heatmap, etc.
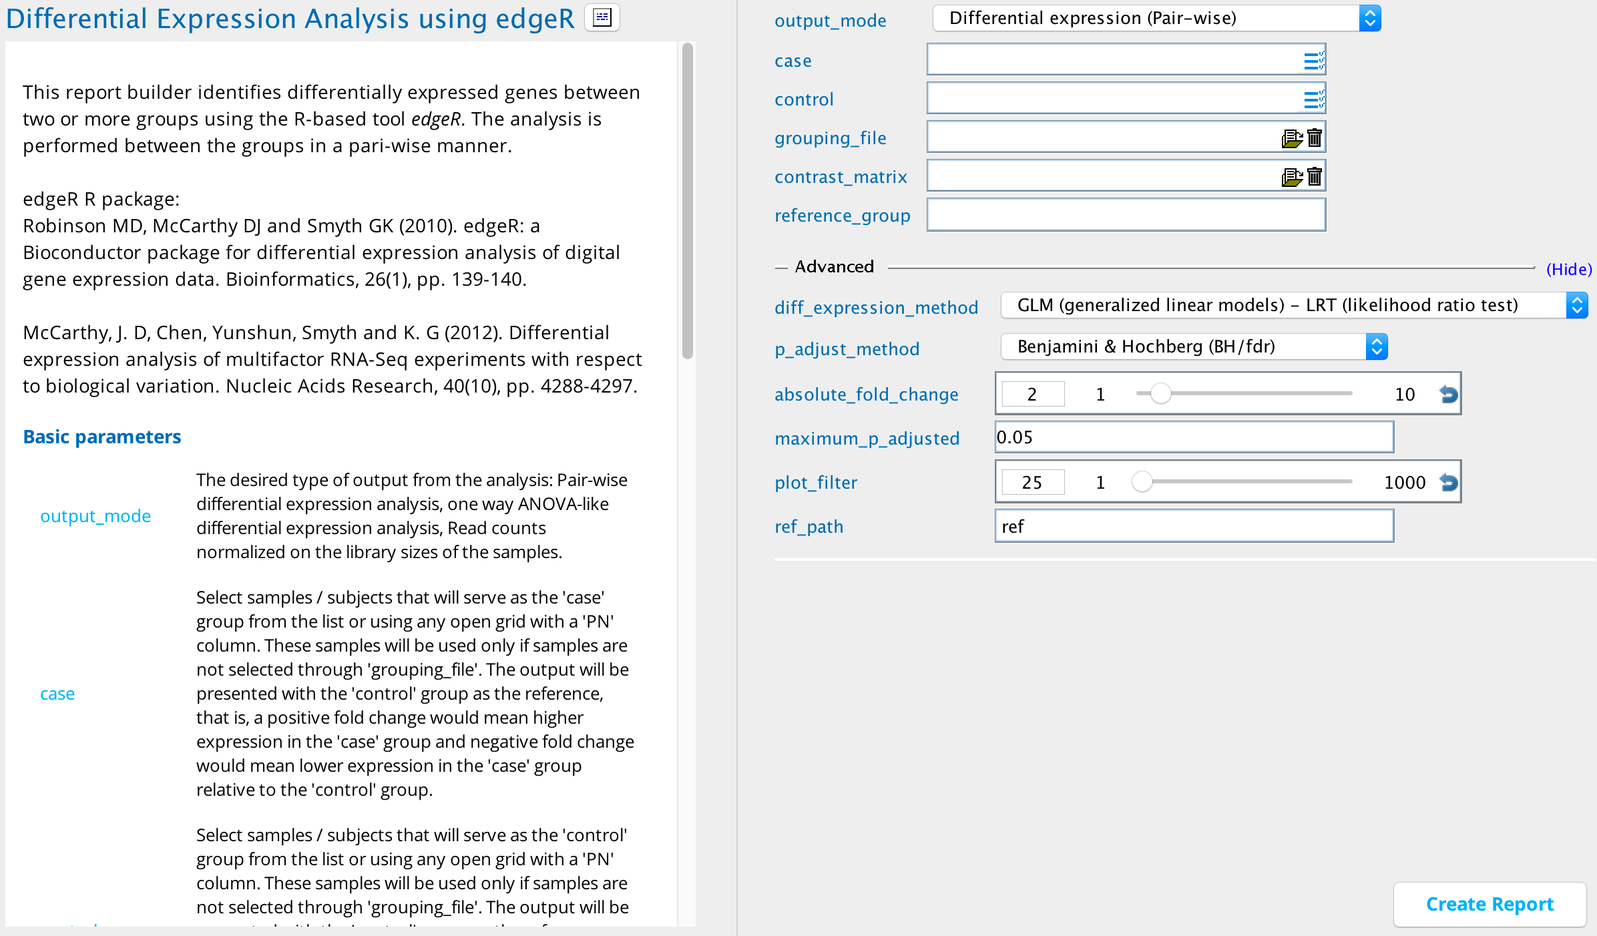
Using the report builder
A basic requirement of the report builder is to provide the non-normalized gene-level expression values per sample in raw integer-based read counts. This is required because edgeR performs a normalization on the read counts based on the library size of the supplied samples before performing the differential expression analysis.
A second requirement is to provide at least two groups of samples; each group should ideally contain biological/technical replicates or at least samples that are expected/known to have similar biological properties. The groups can be supplied by selecting samples in either the case or control input fields or by selecting a grouping_file.
Modes of input
The following three modes of input can be selected in the output_mode field:
Differential expression (Pair-wise)
Differential expression (One-way Anova-like)
Library size-normalized read counts in cpm
Differential expression (Pair-wise)
Differential expression analysis is performed between two groups at a time (pair-wise) and in all combinations possible when more than two groups are provided using the grouping_file input parameter. Following is a link to download an example of a grouping file:
The grouping_file selected must be a tab-delimited file (as in the example) and must include a header with the sample and group information.
The first column must contain the sample names and the second column must contain the desired group names. Note that headers do not have to be labeled “PN” and “Sample_group” as in the example.
This tab-delimited file can contain more than two groups of samples and will override any group of samples selected in the case or control fields.
If a reference_group name is provided, it will be used only when one of the two groups in the pair is being analyzed.
If no reference_group is provided, the control group is used as the reference group in a two-group case-control analysis. In the output, any positive fold change of a gene means that it has higher expression in the case compared to the control, and vice versa.
If multiple groups are provided using the grouping_file input parameter but no reference_group is provided, the group that is listed lower in the grouping_file of any two groups in a given comparison is treated as the control. For example, if the grouping_file contains groups A, B, C, and D and the first sample of each group appears in the same order, then in a comparison between groups B and D (for example), D is used as the control.
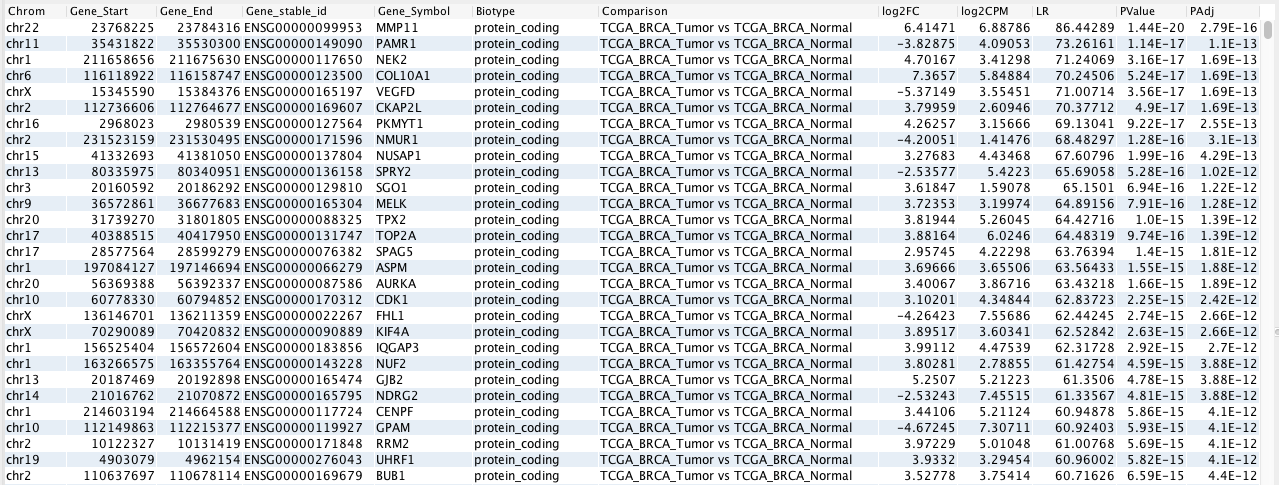
Following is an example of the output in this mode (see also Interpreting the output). For detailed instructions on running the analysis in this mode, see Examples 1-3 in Examples.
Differential expression (One-way ANOVA-like)
Differential expression analysis is performed between all groups provided in the grouping_file input parameter, with a reference group defined in the reference_group field used as the reference group. The reference_group name must match one of the groups in the grouping_file.
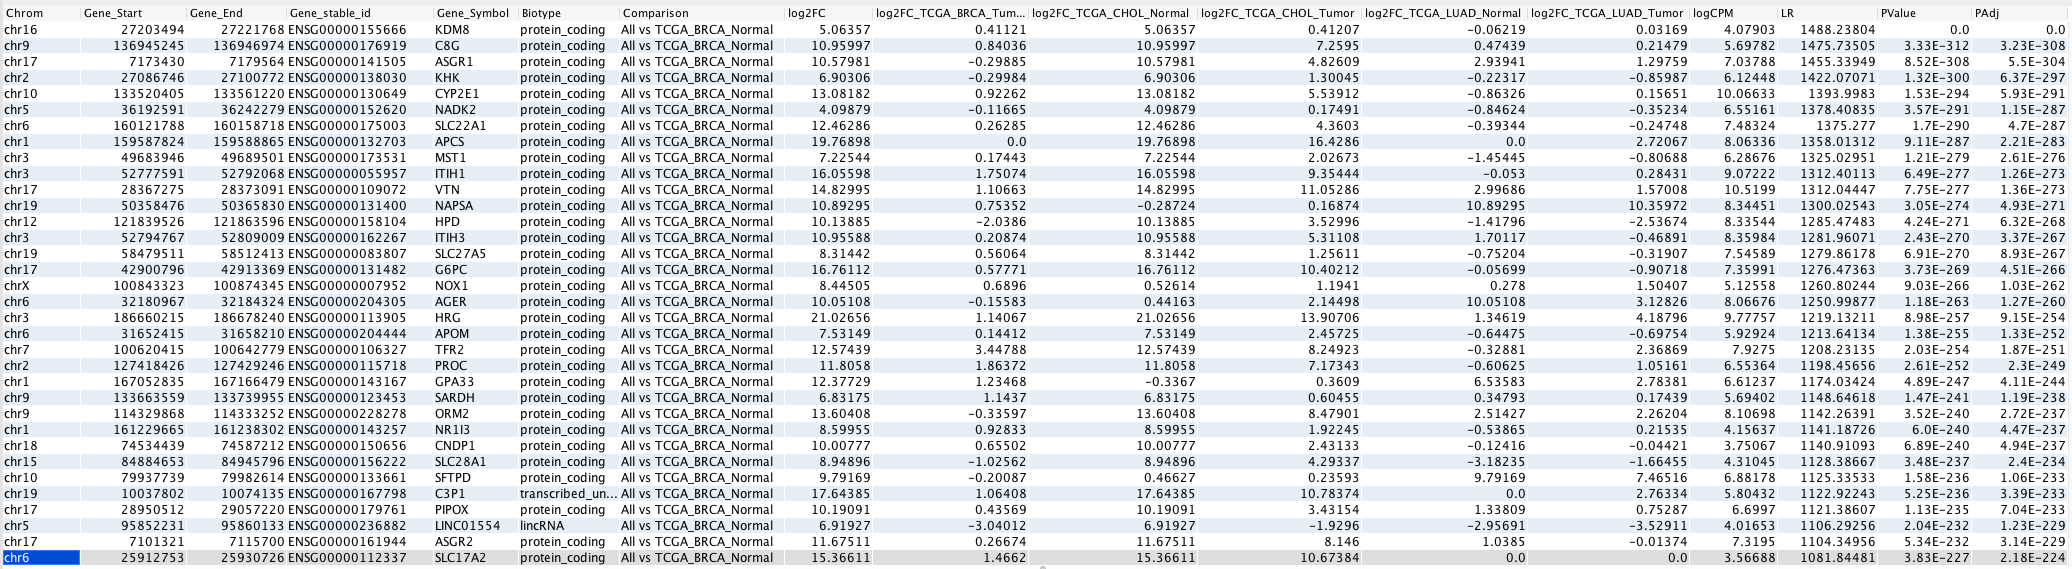
In this mode, multiple fold change is shown – one for each group against the reference group. Following is an example of the output in this mode with “TCGA_BRCA_Normal” as the reference group.
For detailed instructions on running the analysis in this mode, see Example 4 in Examples.
Library size-normalized read counts in cpm
The output in this mode provides the library size-normalized counts of each gene in each sample provided in the case and control or grouping_file input parameters.
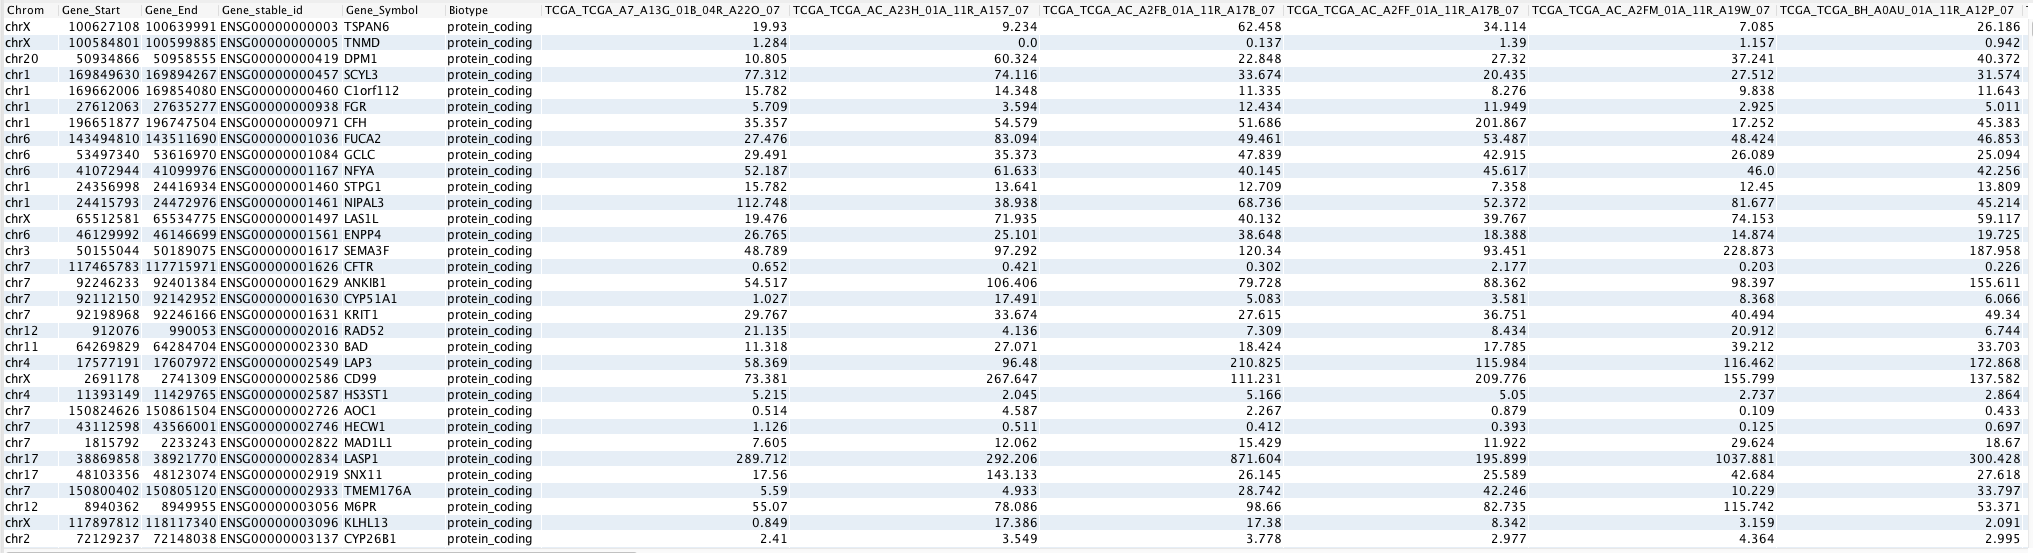
The count values are provided in counts per million (cpm). Following is an example of the normalized read count table.
For detailed instructions on running the analysis in this mode, see Examples 5 and 6 in Examples.
Using a contrast matrix to limit the number of comparisons performed
To perform differential expression analysis on a specific set of pair groups when more than two groups are provided (instead of all possible combinations), a contrast matrix file can be added in the contrast_matrix input field. Following is a link to download an example of a contrast matrix file.
The contrast_matrix file is a tab-delimited file that includes a header. The first column must contain the sample names (the header label can be anything). The remaining columns must contain the numerical values of individual contrasts, with header labels that match the names of the comparisons.
In the example file, the Sample_group column contains all of the groups provided in the grouping_file. In the remaining columns, the header labels “BRCA-T vs BRCA-N” and “PAAD-T vs PAAD-N” represent the names of the comparisons as they appear in the output. The values in these columns represent the groups that are involved in the comparisons. For example, in the PAAD-T vs PAAD-N column, a comparison is made between the groups TCGA-PAAD_Tumor and TCGA-PAAD_Normal (reference group).
In other words, the contrast values represent the coefficients of the groups if the comparisons were represented as a formula. Following are examples of contrasts that can be constructed for example groups A, B, C, and D.
Note
For more information about the structure of the contrasts, refer to the makeContrasts function of the limma package in R 6.
Comparison |
Description |
Reference group |
Contrast |
Equation |
|---|---|---|---|---|
A - B |
Compare expression of group A with group B |
B |
c(1, -1, 0, 0) |
|
B - D |
Compare expression of group B with group D |
D |
c(0, 1, 0, -1) |
|
(A + B)/2 - (C + D)/2 |
Compare the average expression of groups A and B with the average expression of groups C and D |
(C + D)/2 |
c(0.5, 0.5, -0.5, -0.5) |
|
(A - B) - (C - D) |
Compare the difference of expression (differential expression) between groups A and B with the difference of expression between groups C and D |
(C - D) |
c(1, -1, -1, 1) |
|
Selecting statistical methods and tests
It is possible to select the following statistical methods and tests used by edgeR for differential expression analysis:
Generalized linear models (GLM) using a likelihood ratio test (LRT); this is the default
GLM using a quasi-likelihood F-test (QLF)
Exact methods (classic)
Correction methods that can be used by the R P.adjust function to calculate the adjusted p-value can also be selected.
Description of the algorithm
This report builder constructs the following tables, which are required by the underlying edgeR tool to perform differential expression analysis.
Table |
Description |
Source |
|---|---|---|
Counts matrix |
A matrix of integer-based raw gene-level read counts, in which the columns represent individual samples and the rows represent individual genes |
|
Sample info |
A table of sample grouping information, in which the rows represent the same samples in the count matrix and the columns represent the groups of the samples |
Input parameters: case, control, grouping_file |
Contrast matrix (optional) |
A table of contrasts/differential expression analyses to be made by the edgeR tool; the rows represent the samples in the count matrix while the columns represent positive and negative values making individual contrasts |
Input paramter: contrast_matrix |
The edgeR script performs the analysis and returns the result tables (see Column descriptions). The report builder adds useful gene-related information to the output, such as genomic coordinates, biotypes, etc., and rearranges the columns to make the output GOR-compatible.
Interpreting the output
Depending on the output_mode selected, there are two types of output from this report builder:
Differential expression (Pair-wise)/Differential expression (One-way ANOVA-like)
Library size-normalized read counts in cpm
Differential expression (Pair-wise)/Differential expression (One-way ANOVA-like)
In these output modes, the output table displays the results of the differential expression analysis. The name of the comparison is shown in the Comparison column, with the group name after “vs” being the reference group. For example, in the comparison “A vs B”, “B” is the reference group. Therefore, a positive fold change (column log2FC) indicates higher expression in “A” and vice versa.
In One-way ANOVA-like output mode, multiple log2 fold change (log2FC_) columns are provided - one for each group that is compared to the reference group. In such cases, the log2FC column represents the log2 fold change of the highest degree (positive or negative) among all of the groups compared.
If multiple combinations of groups are compared in Pair-wise mode, the results of each comparison are displayed vertically in the table. Within the results of each comparison, genes are arranged in ascending order of adjusted p-value (PAdj), which means that the most statistically significant genes appear at the top of the list for each comparison.
To show only statistically significant genes for each comparison based on the adjusted p-value and the absolute fold change of the gene, the Significant genes perspective can be selected. The cutoffs for this filter can be selected as input parameters in the absolute_fold_change and maximum_p_adjusted fields. Using the default values of “2” for absolute_fold_change and “0.05” for maximum_p_adjusted, this perspective shows only genes that have a fold change of (>= 2 OR <= -2) AND an adjusted p-value < 0.05.
If only two groups are compared in Pair-wise mode and only 50 samples or less are present in total, the output also shows the library size-normalized gene counts of individual samples.
Statistically significant genes identified in this way can be considered to be the genes that have differential expression between the groups compared. This gene list can be used for many downstream analyses, such as determining gene ontology, comparison with other omics data, etc.
Library size-normalized read counts in cpm
This output table displays the log2 of normalized gene-level count values (in count per million) of each sample. The gene-level read counts of each gene in each sample are normalized by taking into consideration the library sizes of all the samples provided. The normalized count values are only valid for further analysis as long as the set of samples is not changed.
Each row in the table represents an individual gene. The Chrom, Gene_Start, Gene_End, Gene_stable_id, and Gene_symbol columns display the genomic location and nomenclature of the gene. Columns with individual sample names display the normalized gene-level counts of the samples.
The normalized count values can be used for various analyses, such as principal component analysis (PCA), clustering samples using expression values, comparing the expression of individual genes of interest across samples, etc. Note that because the counts are not adjusted for gene length, the output from this table should not be used for comparisons between genes within the same sample or across samples.
Column descriptions
Group |
Column |
Description |
|---|---|---|
Gene |
Gene_Start |
Start of the genomic location of the gene |
Gene_End |
End of the genomic location of the gene |
|
Gene_stable_id |
Ensembl gene ID |
|
Gene_symbol |
HUGO gene symbol |
|
Other columns |
Biotype |
The biological type of the gene |
Comparison |
The comparison that was made in the differential expression analysis |
|
log2CPM |
Log2 of average count values of all the samples, expressed in counts per million (cpm) |
|
log2FC |
Log2 of expression fold change between the groups of the comparison; a positive value indicates higher expression in the control group compared to the reference group and vice versa |
|
LR |
Likelihood ratio statistics |
|
PAdj |
Adjusted p-value for the gene |
|
PValue |
Calculated value for the gene in the selected comparison |
|
Sample names |
The normalized expression value of the gene in the sample specified in the column name; these columns are visible only in the Library size-normalized read counts in cpm output mode OR in the Differential expression (Pair-wise) output mode when only two groups are compared and the total number of samples is not more than 50. |
Examples
Following are several example comparisons and the steps to perform them using this report builder.
1. Comparison of expression between two groups of samples
Following are steps to perform a differential expression analysis between two groups of samples: breast cancer and normal samples in TCGA.
In the output_mode field, select Differential expression (Pair-wise).
In the case field, select the breast tumor samples using the following sample metadata:
TCGA_project: “BRCA”
Type: “Primary Solid Tumor”, “Recurrent Solid Tumor”, and “Metastatic”
In the control field, select the breast normal samples using the following sample metadata:
TCGA_project: “BRCA”
Type: “Solid Tissue Normal”
The group names in the output are automatically assigned as “CASE” and “CONTROL”. By default, the breast normal samples are used as the reference group against which the comparisons are made because they were selected as the control input parameter. The reference_group field can be left blank.
In this example, a positive fold change in the output indicates higher expression in the tumor samples and vice versa. However, the breast tumor samples can still be treated as the reference group if the name “CASE” is provided in the reference_group field (see also Interpreting the output).
2. Pair-wise comparison of expression between two or more groups of samples
Following are steps to perform a differential expression analysis between 10 groups of samples - tumor and normal samples of five cancer types in TCGA (ACC, BRCA, LUAD, PAAD, and READ).
In the output_mode field, select Differential expression (Pair-wise).
Select a subset of tumor and normal samples of five cancer types in TCGA by selecting the example tab-delimited grouping_file provided:
TCGA_demo_tumor_normal_expression_groupings.txt.(Optional) In the reference_group field, enter a group name (for example “TCGA-BRCA_Tumor”) to use as the reference group in which pair combinations the chosen group present in. Note that if samples were already selected in the case and control fields, they will be overridden by the samples in the grouping_file.
If only the grouping_file is used, the report builder runs differential expression analysis separately on all combinations of groups, comparing two groups at a time. In any combination, the group whose first sample appears lower in the grouping file is treated as the reference group.
For example, in a comparison of TCGA-CHOL_Tumor and TCGA-PAAD_Tumor, TCGA-PAAD Tumor is treated as the reference group because the first sample of TCGA-PAAD_Tumor appears lower in the grouping_file than the first sample of TCGA-CHOL_Tumor. Therefore, it is important to list samples in the desired order of comparison.
A ”universal” reference group can be defined in the reference_group field, to be used as the reference in whichever pair-wise combinations the group is present in and regardless of whether the group’s sample appears first.
For example, if TCGA-BRCA_Tumor is selected in the reference_group field, it is used as the reference group in a comparison between TCGA-BRCA_Tumor and TCGA-PAAD_Tumor, even though the first sample of TCGA-BRCA_Tumor appears before the first sample of TCGA-PAAD_Tumor. However, in a comparison between TCGA_CHOL_Tumor and TCGA-PAAD_Tumor, it is ignored and TCGA-PAAD_Tumor is used as the reference group instead.
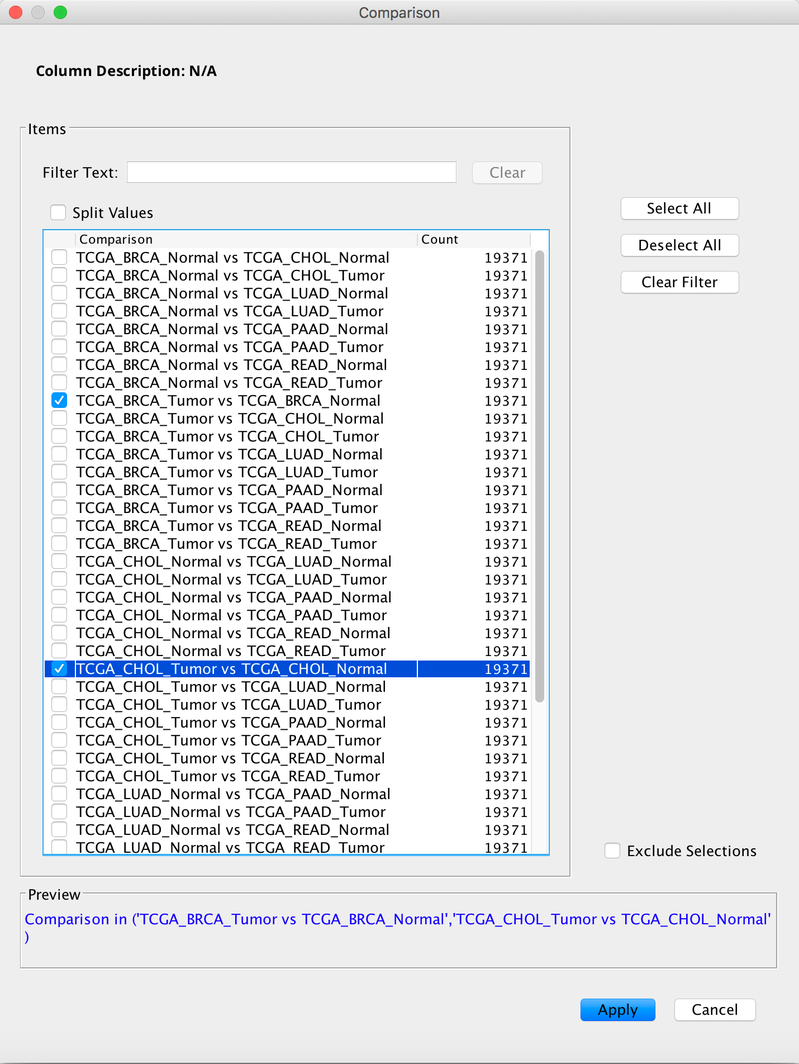
The output in this example looks similar to that of the two-group comparison, except that the results of each pair-wise comparison are displayed vertically and no columns with library size-normalized gene counts of individual samples are shown. The Comparison column can be filtered to show only comparisons of interest.
3. Selective pair-wise comparison of expression using two or more groups of samples
Following are steps to perform a differential expression analysis between breast (BRCA) tumor and normal samples and between pancreatic (PAAD) tumor and normal samples among samples of five different cancer types in TCGA (ACC, BRCA, LUAD, PAAD, and READ).
In the output_mode field, select Differential expression (Pair-wise).
Select a subset of tumor and normal samples of five cancer types in TCGA by selecting the example tab-delimited grouping_file provided:
TCGA_demo_tumor_normal_expression_groupings.txt.In the contrast_matrix field, upload the example contrast matrix file provided:
TCGA_demo_tumor_normal_expression_contrast.tsv.
In this example, the differential expression analysis is performed between only a set of selected group pairs. By using a contrast matrix, less meaningful or redundant comparisons can be avoided, for example TCGA-BRCA_Normal vs TCGA-PAAD_Normal, TCGA-CHOL_Normal vs TCGA_READ_Normal, etc.
4. One-way ANOVA-like analysis of expression between multiple groups of samples
Following are steps to perform a one-way ANOVA-like differential expression analysis between 10 groups of samples - tumor and normal samples of five cancer types in TCGA (ACC, BRCA, LUAD, PAAD, and READ). This example uses the breast normal group (TCGA-BRCA_Normal) as the reference group.
In the output_mode field, select Differential expression (One way ANOVA-like).
Select a subset of tumor and normal samples of five cancer types in TCGA by selecting the example tab-delimited grouping_file provided:
TCGA_demo_tumor_normal_expression_groupings.txt.In the reference_group field, enter “TCGA-BRCA_Tumor” (without quotation marks).
In the output, the expression of the other nine groups is compared simultaneously against the expression in the TCGA-BRCA_Normal group (see also :ref: interpretOutput).
5. Normalization of read counts of two groups of samples
Following are steps to generate a table of the library size-normalized read counts of two groups of samples - breast tumor and normal samples in TCGA.
In the output_mode field, select Library size-normalized read counts in cpm.
In the case field, select the breast tumor samples using the following sample metadata:
TCGA_project: “BRCA”
Type: “Primary Solid Tumor”, “Recurrent Solid Tumor”, and “Metastatic”
In the control field, select the breast normal samples using the following sample metadata:
TCGA_project: “BRCA”
Type: “Solid Tissue Normal”
For an explanation of the output, see Interpreting the output.
The groups TCGA-BRCA_Tumor and TCGA-BRCA_Normal can also be provided using the grouping_file input parameter. In this case, the file would contain the samples of only the two groups. In this output mode, the selection of any sample in the case or control fields is the same because both samples are pooled together and no differential analysis is performed. In addition, samples selected in the case and control fields are ignored if samples are also selected using a grouping_file.
6. Normalization of read counts of two or more groups of samples
Following are steps to generate an output table of library size-normalized read counts of 10 groups of samples - tumor and normal samples of five cancer types in TCGA (ACC, BRCA, LUAD, PAAD, and READ).
In the output_mode field, select Library size-normalized read counts in cpm.
Select a subset of tumor and normal samples of five cancer types in TCGA by selecting the example tab-delimited grouping_file provided:
TCGA_demo_tumor_normal_expression_groupings.txt.
In this example, samples that are also selected in the case and control fields are automatically ignored and are not combined with the samples in the grouping_file.
References
- 1
Robinson MD, McCarthy DJ and Smyth GK. edgeR: a Bioconductor package for differential expression analysis of digital gene expression data. Bioinformatics. 2010;26(1): 139-140.
- 2
McCarthy, J. D, Chen, Yunshun, Smyth and K. G. Differential expression analysis of multifactor RNA-Seq experiments with respect to biological variation. Nucleic Acids Res. 2012;40(10): 4288-4297.
- 3
https://bioconductor.org/packages/release/bioc/html/edgeR.html
- 4
https://bioconductor.org/packages/release/bioc/vignettes/edgeR/inst/doc/edgeRUsersGuide.pdf
- 5
https://www.rdocumentation.org/packages/edgeR/versions/3.14.0
- 6
https://www.rdocumentation.org/packages/limma/versions/3.28.14/topics/makeContrasts