Cancer QC and statistics
The Cancer QC and statistics report builder calculates and reports variant statistics for tumor samples. The QC statistics are reported for each sample as compared to the distribution of the QC attribute values for all input samples. This report builder can be a logical first step in the analysis of one or multiple tumor or tumor-normal pair samples as it provides an overview of the quality and characteristics of the variants. The output includes an InDistribution column that indicates for each sample and attribute whether it falls within the normal distribution. The following attributes are included in the output:
Variant counts: The total number of variants in the sample; the count reflects the number of variants based on the filters set in the “variant_quality_filter”, “minimum_call_ratio”, and “minimum_read_depth” input fields
SNV type: The breakdown of different types of single nucleotide variants (SNV) based on the substitution: C>T, C>A, C>G, T>C, and T>A
Transition-transversion analysis: The number of transition (purine to purine or pyrimidine to pyrimidine) and transversion (purine to pyrimidine or vice versa) mutations in the sample
SNP vs InDel analysis: Comparative analysis between the number of single nucleotide variants (SNV) and insertions/deletions in the sample
Variant Coverage: The average and median variant depth is provided for all variants and for high-quality variants. High-quality variants are those occuring in reads with MAPQ >= 20 (MAPQ = -10*log10 (probability mapping position is incorrect)).
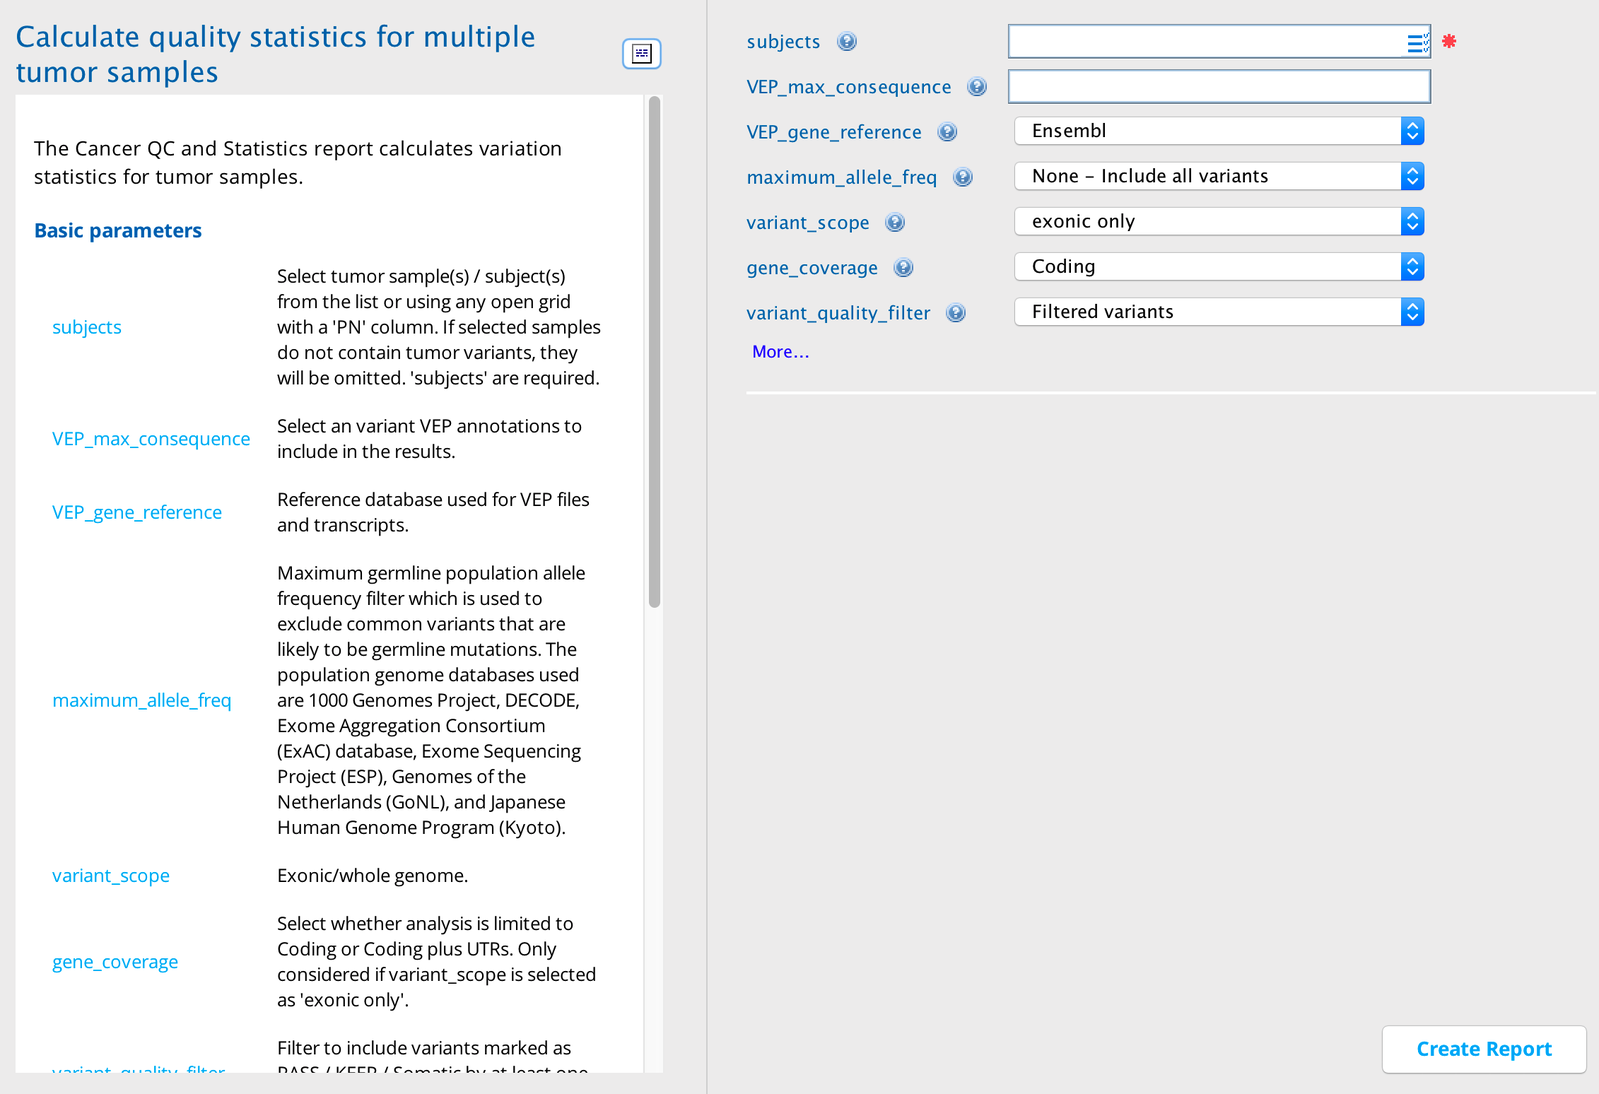
Cancer QC and Statistics in Sequence Miner
Example use case
The user has WGS/WES sequences of about 100 tumor samples of a particular cancer type and wishes to evaluate overall data quality and types of variants in the samples. If previous results from samples of the same type of cancer are already known, a comparison can be made to check the consistency of the results in the current output.
The user wants to identify any bad quality or outlier samples in a dataset or cohort.
Interpreting the output
The Default view perspective displays results for six different types of analysis and distribution scores. The maximum number of rows per sample is 16.
Variant counts: The total number of variants in the sample will be included in the Mutation_count column. This displays one row per sample.
SNV type: The breakdown of different types of single nucleotide variants (SNV) based on the substitutions: C>T, C>A, C>G, T>C, and T>A; the analysis displays five rows per sample. The mutation counts and percentages will be included in the Mutation_count and Mutation_percent columns, respectively. The prevalence of a particular mutation type in tumor samples have been associated with specific types of cancer. For example, in certain breast cancer genomes, C>T and C>G are highly prevalent (1) whereas in lung cancer, C>A mutations are more prevalent (2).
SNP vs InDel Analysis: The breakdown of SNV, insertions, and deletions in the sample; the analysis displays three rows per sample. The mutation counts and percentages will be included in the Mutation_count and ‘Mutation_percent’ columns, respectively. The proportions of SNP and Indels are expected to be >0.96 and >0.03, respectively. In the TCGA dataset, approximately 3% of mutations were indels.
Transition transversion Analysis: The number of transition and transversion type of mutations in the sample; the transition/transversion ratio is also provided. This analysis displays 3 rows per sample. The mutation counts and percentages will be included in the Mutation_count and Mutation_percent columns, respectively. The percentage of transitions and transversion varies across different cancer types. In general, transitions are more common in most type of cancers. However, transversions are more common in lung cancers (2).
Variant Coverage: In the Mutation_type column, four variant coverage metrics are displayed per sample. They include the average and median variant depth for all variants, and for high-quality variants in a given sample (see also Variant Coverage perspective).
Z-score and distribution: The Default view perspective also includes a Z-score column, which is the number of standard deviations from the mean value for a given attribute. The attribute measurement for each subject is compared to its distribution across the other input subjects.
The corresponding rank (Low, Normal, or High) of the attribute value for each subject compared to the distribution of all the input subjects is displayed in the InDistribution column. The InDistribution column indicates how a sample attribute (in a given row) compares to the other samples selected for this analysis.
If the Z-score (the value in the all_z_proportion column is the number of standard deviations away from the mean) is < -2.0 (more than 2 standard deviations BELOW the mean), the attribute is categorized as falling at the LOW end of the distribution of all the input subjects (designated in the all_InDistribution column).
If the Z-score is > +2.0 (more than 2 standard deviations ABOVE the mean), the attribute is categorized as falling at the HIGH end of the distribution of all the input subjects
If the Z-score is between -2.0 and and +2.0 (within 2 standard deviations of the mean), the attribute is categorized falling within the NORMAL range of the distribution of all the input subjects.
The Color column indicates how a given value for an attribute compares to the mean in terms of standard deviation.
If the value falls in the range of +/- two standard deviations of the mean, the term “Green” is returned.
If value falls in the range of +/- (2 to 3) standard deviation of the mean, the term “Orange” is returned.
Otherwise, if teh value is +/- 3 or more standard deviations away from the mean, the term “Red” is returned.
The Counts perspective displays only the mutation counts for the first four analyses mentioned above: variant counts, SNV type, SNP vs InDel analysis, and transition transversion analysis.
The Percentages perspective displays the percentage of every mutation type: transitions, transversions, SNPs, deletions, and insertions.
The Ratios perspective displays the transition vs transversion ratio for all the input samples. Across the entire genome the ratio of transitions to transversions is typically around 2. However, in tumor samples this ratio varies across different tumor types. For example, low ratios (lower than 0.5) are expected for lung adenocarcinoma and high ratios (3 or more) are expected in glioblastoma and acute myeloid leukemia (2).
The Variant Coverage perspective displays four analyses per sample:
Avg variant depth: Average of variant depth across the sample
Avg variant depth hq: Average of high quality variant depth across the sample
Median variant depth: Median of variant depth across the sample
Median variant depth hq: Median of high quality variant depth across the sample
Column descriptions
Group |
Column |
Description |
|---|---|---|
Mutation |
Mutation_count |
Count of mutations for the corresponding mutation type |
Mutation_percent |
Percent of mutations for the corresponding mutation type within the subject/PN |
|
Mutation_type |
Mutation type / process of mutation / variant quality info / base substitutions |
|
Mutation_value |
Calculated value for the corresponding variant depth (average or median) |
|
rank |
rank_perc_FromBottom |
Samples are ranked in order based on their attribute values, with 1 being the highest rank assigned to the sample with the lowest attribute value |
rank_perc_FromTop |
Samples are ranked in order based on their attribute values (e.g., 1 - 21 for 21 samples), with 1 being the highest rank assigned to the sample with the highest attribute value |
|
Other columns |
Analysis |
Type of analysis |
Color |
A color code to determine whether a particular value is within some acceptable/normal range from the mean: “Green” (acceptable) - within +/- 2 standard deviations of the mean; “Orange” - more than +/- 2 standard deviations of the mean but less than or equal to +/- 3 standard deviations; “Red” - more than +/- 3 standard deviations from the mean |
|
InDistribution |
Displays where the proportion value of the sample falls in the distribution of the values for all the input samples |
|
lowOReqRankFromBottom |
Samples are ranked proportionally on a scale of 0 to 1, with 0 being the highest rank assigned to the sample with the lowest attribute value |
|
lowOReqRankFromTop |
Samples are ranked proportionally on a scale of 0 to 1 (each step in rank is 1 / # of samples), with 0 being the highest rank assigned to the sample with the highest attribute value |
|
PN |
Patient number/subject ID |
|
Ratio |
Transition vs transversion ratio |
|
SNV_count |
Count of small nucleotide variants (SNVs) for the sample |
|
TsTv |
Transition (Ts) or Transversion (Tv) |
|
Z_score |
The number of standard deviations from the mean value for a given attribute |
Perspective views
Perspectives subtabs focus on a subset of the columns in the Default view.
Perspective |
Description |
|---|---|
Counts |
Displays all the columns related to the counts of all the mutation types in the sample |
Default view |
Displays all columns |
Percentages |
Displays the columns related to the percentage of all the mutation types in a sample; includes the mutation type percentages of SNPs, insertions, deletions, transitions, and transversions |
Ratios |
Displays the transition to transversion ratio columns |
Variant Coverage |
Displays the columns related to the average or median depth of variants in the sample; displayed for total depth and high quality or “hq” (MAPQ>20) depth |
References
Alexandrov LB, Nik-Zainal S, Wedge DC, et al. Signatures of mutational processes in human cancer. Nature. 2013; 500(7463):415-421.
Kandoth CV, McLellan M, Vandin F, et al. Mutational landscape and significance across 12 major cancer types. Nature. 2013; 502:333-339.