Variant association ExAC (WES)
Variant association ExAC (WES) module in Sequence Miner
Example use case
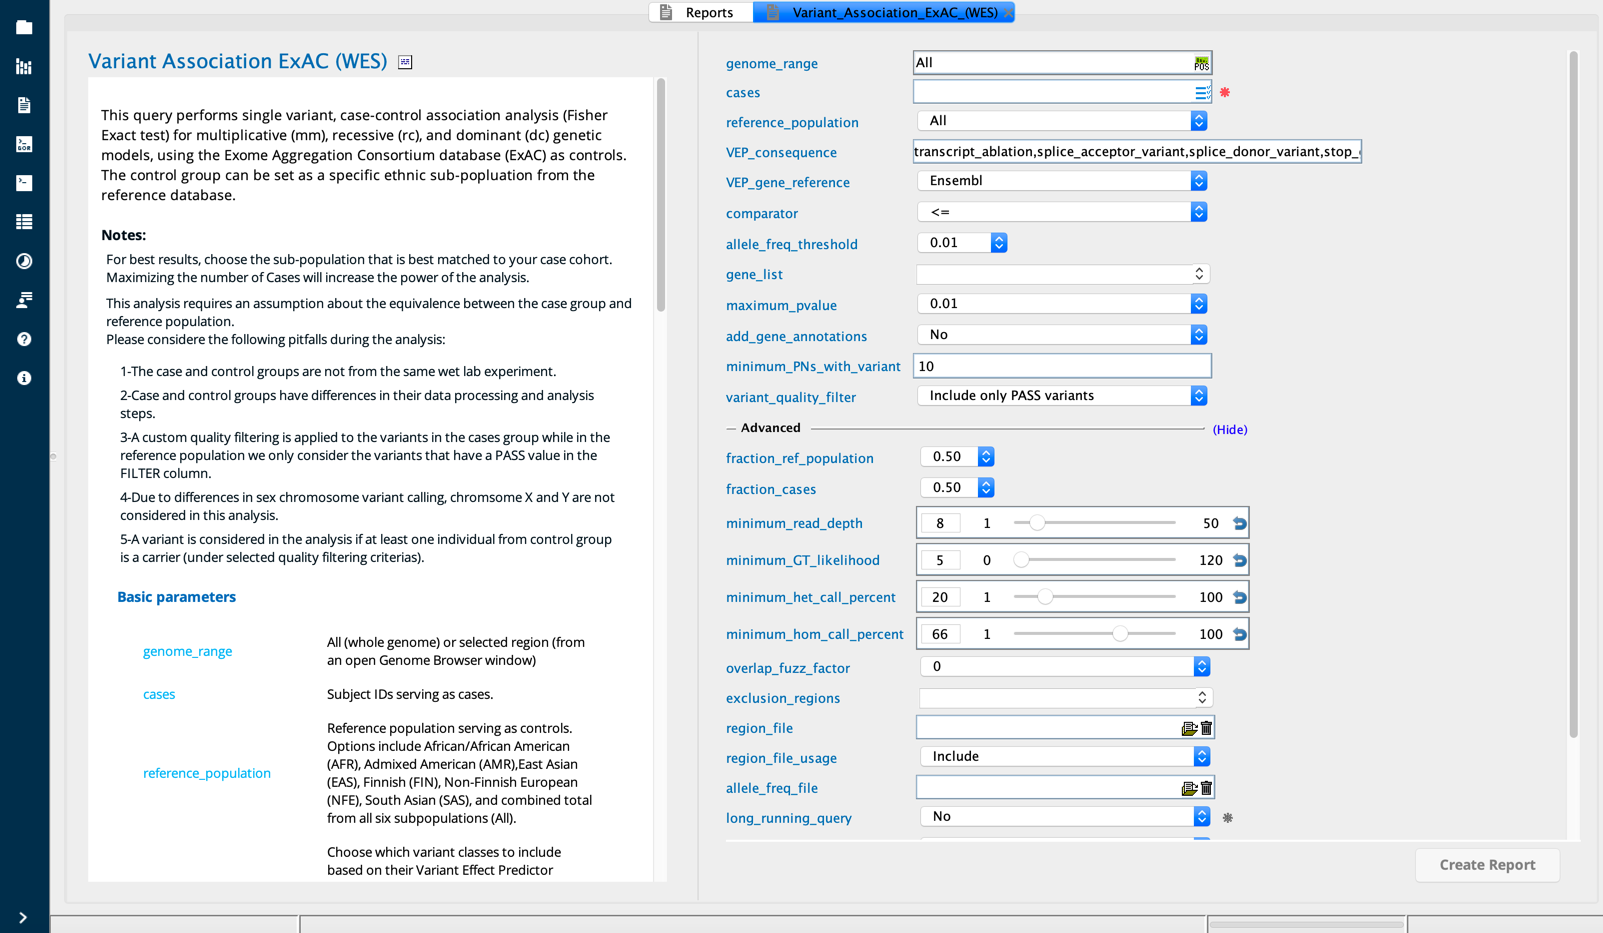
The Variant Association Ref Population report builder performs a single variant case-control association analysis using publicly available Exome Aggregation Consortium (ExAC) whole-exome sequenced data as control.
The analysis is a Fisher’s exact test based on the presence or absence of each variant in cases and controls. The ExAC reference population database for allele counts serves as a proxy for controls. The allele count information for each variant, as counted in the case group and the reference population, is used to create 2x2 contingency tables.
Deviating from matched populations
This analysis requires an assumption about the equivalence between the case group and reference population. Differences between the case and control group will lead to incorrect results. Please note the following considerations:
In this analysis, the case and control groups will not be from the same wet lab experiment. Differences in sample preparation and sequencing can invalidate the comparison between these cohorts.
Case and control groups also have differences in their analysis steps. The variants listed in the case group and the control group have been called and filtered using different techniques. A quality filtering is applied to the variants in the cases group, while in the reference population the tool uses only the variants that have a PASS value (VCF-derived column named “FILTER”). For the reference population, non-PASS variants will be excluded from analysis.
If there is a substantial difference in sample size between case and control groups ( unbalanced groups), this will inflate the type I error rate.
The tool only takes into account variants that are present at least once in the cases group.
Estimating the control total allele number for variants that are absent in the reference population
When the variant identified in the case group is not present in the reference file, the control total allele number for the variant in question is estimated from the reference data file. A variant present in the case group but absent in the reference file will be annotated as follows:
Control allele count (CTRL_alleles) will be 0 as it is absent from the controls
Control total allele number (CTRL_total_alleles) is estimated by the nearest ‘PASS’ variant in the reference population table. If there is no ‘PASS’ variant within 50 bp of the missing variant, it is assumed that this position has bad coverage in the reference file and therefore the variant will be excluded from analysis.
Selecting an appropriate subpopulation
The control population is defined by the reference population input parameter. The reference population should be selected to match the case group ethnicity as closely as possible. By default, the reference population parameter is set to “All”, corresponding to the entire ExAC database except the subpopulation “Others (OTH)”. The following options are available for subpopulations:
African/African American (AFR)
Admixed American (AMR)
East Asian (EAS)
Finnish (FIN)
Non-Finnish European (NFE)
South Asian (SAS)
A brief summary of these subpopulations is provided by the ExAC project: http://exac.broadinstitute.org/faq.
Note
Phenotypic information is not available for individuals in the reference population. These individuals may carry the phenotype or genetic condition under consideration in your case-control analysis.
Description of the algorithm
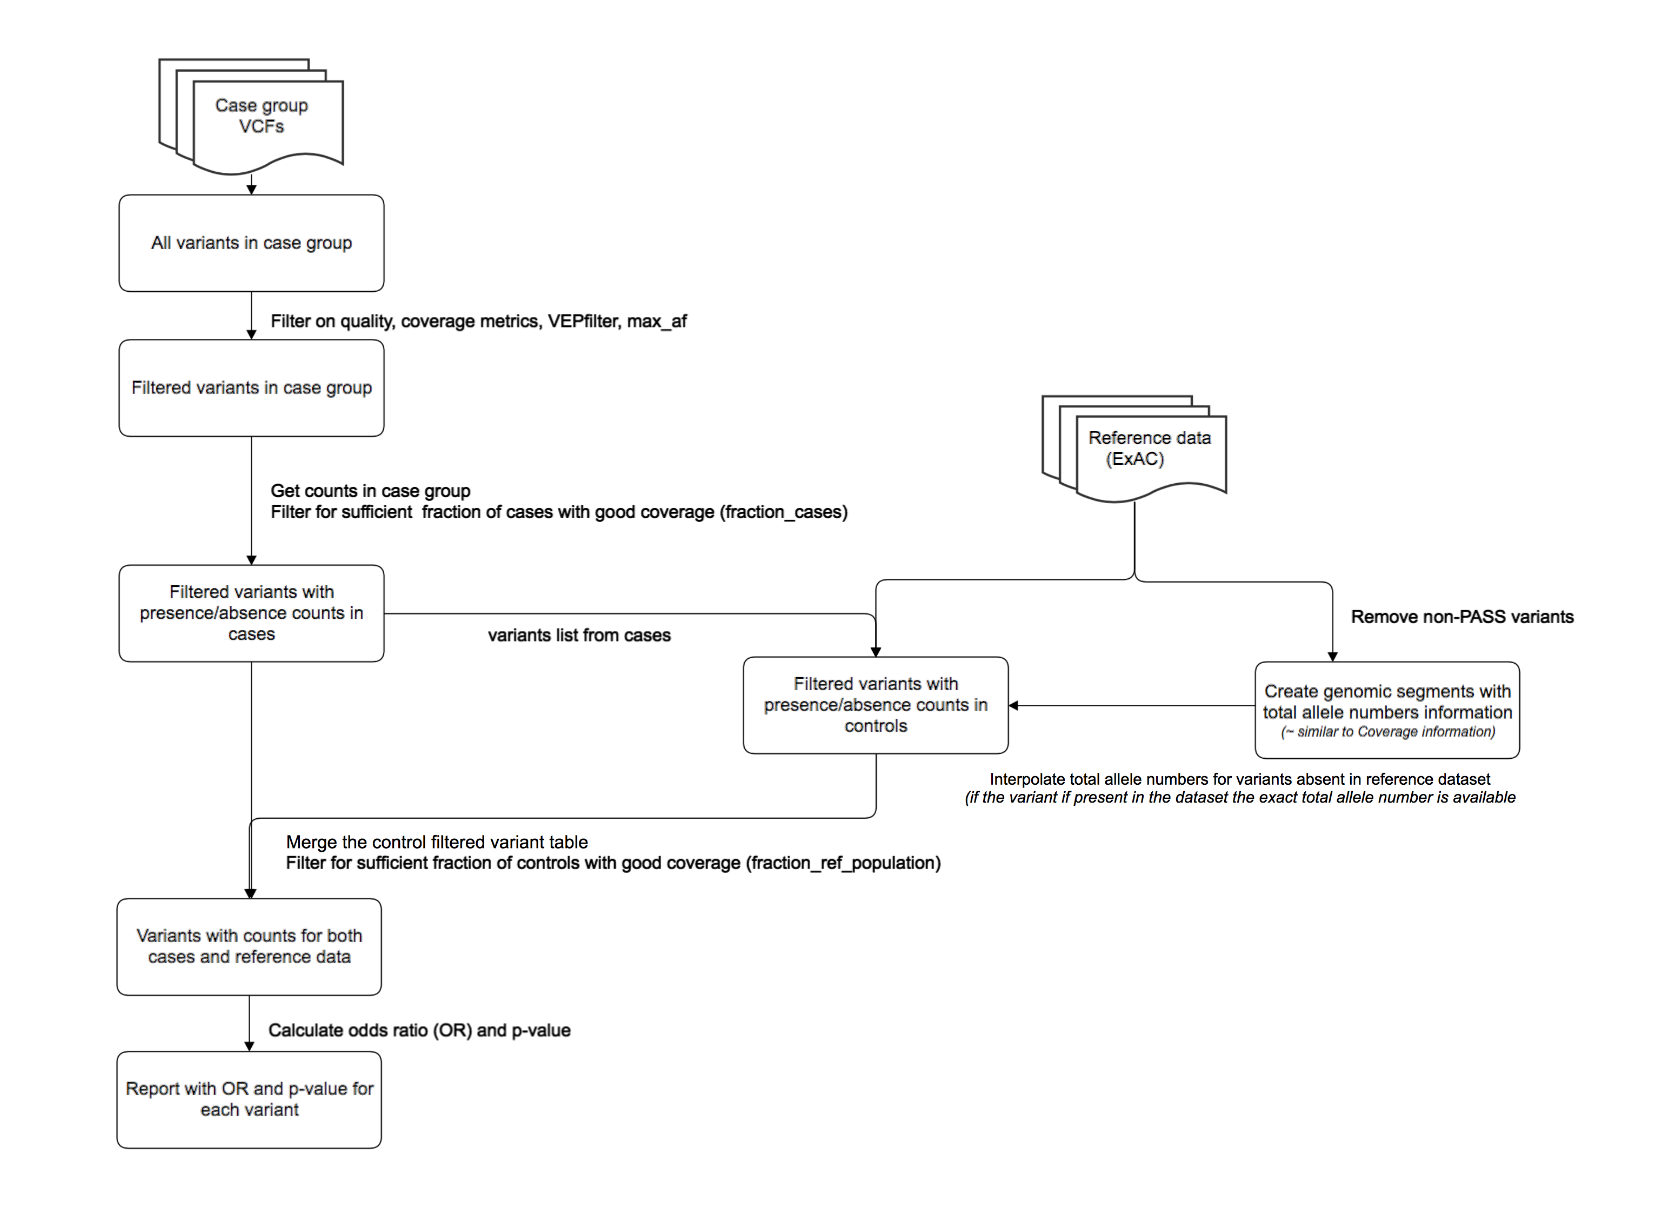
All variants identified in Cases are filtered according to the input parameters. For all filtered variants, the following counts are determined:
The number of variant alleles
The number of homozygous individuals
The total number of alleles with good coverage
For each variant, these counts are used to define 2x2 contingency tables for three models: dominant, recessive, and multiplicactive. For each contingency table, calculations are performed to determine the odds ratio and 2-tailed Fisher’s exact test p-value.
Contingency tables are constucted as follows. In general, the “A” and “B” values ae obtained from the Case data, while the “C” and “D” values are derived from the selected reference population.
With variant |
Without variant |
|
|---|---|---|
Case alleles |
A |
B |
Control alleles |
C |
D |
With variant |
Without variant |
|
|---|---|---|
Case alleles |
|
|
Control alleles |
|
|
With variant |
Without variant |
|
|---|---|---|
Case alleles |
|
|
Control alleles |
|
|
With variant |
Without variant |
|
|---|---|---|
Case alleles |
|
|
Control alleles |
|
|
The 2-tailed Fisher’s exact test is performed for each model according to the contingency tables above. Similarly, the odds ratio (OR) for each model is calculated as follows, using a general formula which corresponds to the Generic 2x2 contingency table:
Odds Ratio = (A/B) / (C/D)
Multiplicative Odds Ratio = (case_alleles/case_absent_alleles) / (ctrl_alleles/ctrl_absent_alleles)
Dominant Odds Ratio = (case_present/case_absent) / (ctrl_present/ctrl_absent)
Recessive Odds Ratio = (case_hom/case_absent_hom) / (ctrl_hom/ctrl_absent_hom)
The output includes an OR for each variant for each of the three models. Follow are three exceptions to this OR formula:
When B = 0 and D ≠ 0, the Odds Ratio value will be 1000
When C = 0, the Odds Ratio value will be 1000
When D = 0, the Odds Ratio value will be NaN
Interpreting the output
A 2-tailed Fisher’s exact test p-value is returned. The p-value indicates a measure of statistical significance for each model. An odds ratio (OR) > 1 indicates that the variant is more common in cases compared to controls.
For each variant position, the number of individuals in the reference population can be considered (given in the CTRL_total_PNs column). If the number is below a desired threshold, the variant can be flagged or excluded from analysis.
Column descriptions
Group |
Column |
Description |
|---|---|---|
Basic |
Chrom, Pos, Reference, Call |
Basic variant information |
CASE |
CASE_absent |
The number of cases in which the variant allele is absent |
CASE_absent_alleles |
The total number of reference alleles in cases |
|
CASE_absent_hom |
The number of cases that are not homozygous for the variant allele |
|
CASE_alleles |
The total number of variant alleles in cases |
|
CASE_het |
The number of cases that are heterozygous for the variant allele |
|
CASE_hom |
The number of cases that are homozygous for the variant allele |
|
CASE_present |
The number of cases in which the variant allele is present |
|
CASE_prop_alleles |
The proportion of variant alleles / total alleles with good coverage in the case group |
|
CASE_prop_het |
The proportion of individuals that are heterozygous for the variant allele / total number of individuals with good coverage in the case group |
|
CASE_prop_hom |
The proportion of individuals that are homozygous for the variant allele / total number of individuals with good coverage in the case group |
|
CASE_total_alleles |
The total number of alleles with good coverage in the case group |
|
CASE_total_PNs |
The total number of individuals with good coverage in the case group |
|
CASE_unknown |
The number of cases with low coverage or a poor quality call at this position |
|
CTRL |
CTRL_absent |
The number of controls in which the variant allele is absent |
CTRL_absent_alleles |
The total number of reference alleles in controls |
|
CTRL_absent_hom |
The number of controls that are not homozygous for the variant allele |
|
CTRL_alleles |
The total number of variant alleles in controls |
|
CTRL_het |
The number of controls that are heterozygous for the variant allele |
|
CTRL_hom |
The number of controls that are homozygous for the variant allele |
|
CTRL_present |
The number of controls in which the variant allele is present |
|
CTRL_prop_alleles |
The proportion of variant alleles / total alleles with good coverage in the control group |
|
CTRL_prop_het |
The proportion of individuals that are heterozygous for the variant allele / total number of individuals with good coverage in the control group |
|
CTRL_prop_hom |
The proportion of individuals that are homozygous for the variant allele / total number of individuals with good coverage in the control group |
|
CTRL_total_alleles |
The total number of alleles with good coverage in the control group |
|
CTRL_total_PNs |
The total number of individuals with good coverage in the control group |
|
CTRL_unknown |
The number of controls with low coverage or a poor quality call at this position |
|
MAX |
MAX_AF |
Maximum reported allele frequency across the population surveys from 1000GP3, EVS, ExAC, Kyoto, GONL, and DeCODE |
Max_Impact |
Classification of the level of severity of the transcript consequence type assigned by VEP |
|
OR |
OR_dom |
Odds ratio as calculated from the 2x2 contingency table for the dominant model:
|
OR_mm |
Odds ratio as calculated from the 2x2 contingency table for the multiplicative model:
|
|
OR_rec |
Odds ratio as calculated from the 2x2 contingency table for the recessive model:
|
|
pVal |
pVal_dom |
Measure of statistical significance of the difference between the distribution of carriers in the case group versus the reference population |
pVal_mm |
Measure of statistical significance of the difference between the distribution of variant alleles in the case group versus the reference population |
|
pVal_rec |
Measure of statistical significance of the difference between the distribution of homozygous carriers in the case group versus the reference population |
|
Other columns |
Gene_symbol |
HUGO gene symbol associated with this variant |
Perspective views
Perspectives subtabs focus on subsets of the columns in the Default view.
Perspective |
Description |
|---|---|
Default view |
|
Dominant Model |
|
Multiplicative Model |
|
Recessive Model |