Single point regression
The Single point regression report builder performs linear or logistic regression analysis on samples with variant and phenotype data. A regression analysis determines the relationship between an explanatory variable (the independent variable, “x”) and the outcome, the response variable (the dependent variable, “y”). Linear regression fits a linear data model to a continuous response variable; logistic regression is used to fit to a dichotomous response variable. For each variant, this query returns the effect size, a p-value and several other statistical measures for each covariate.
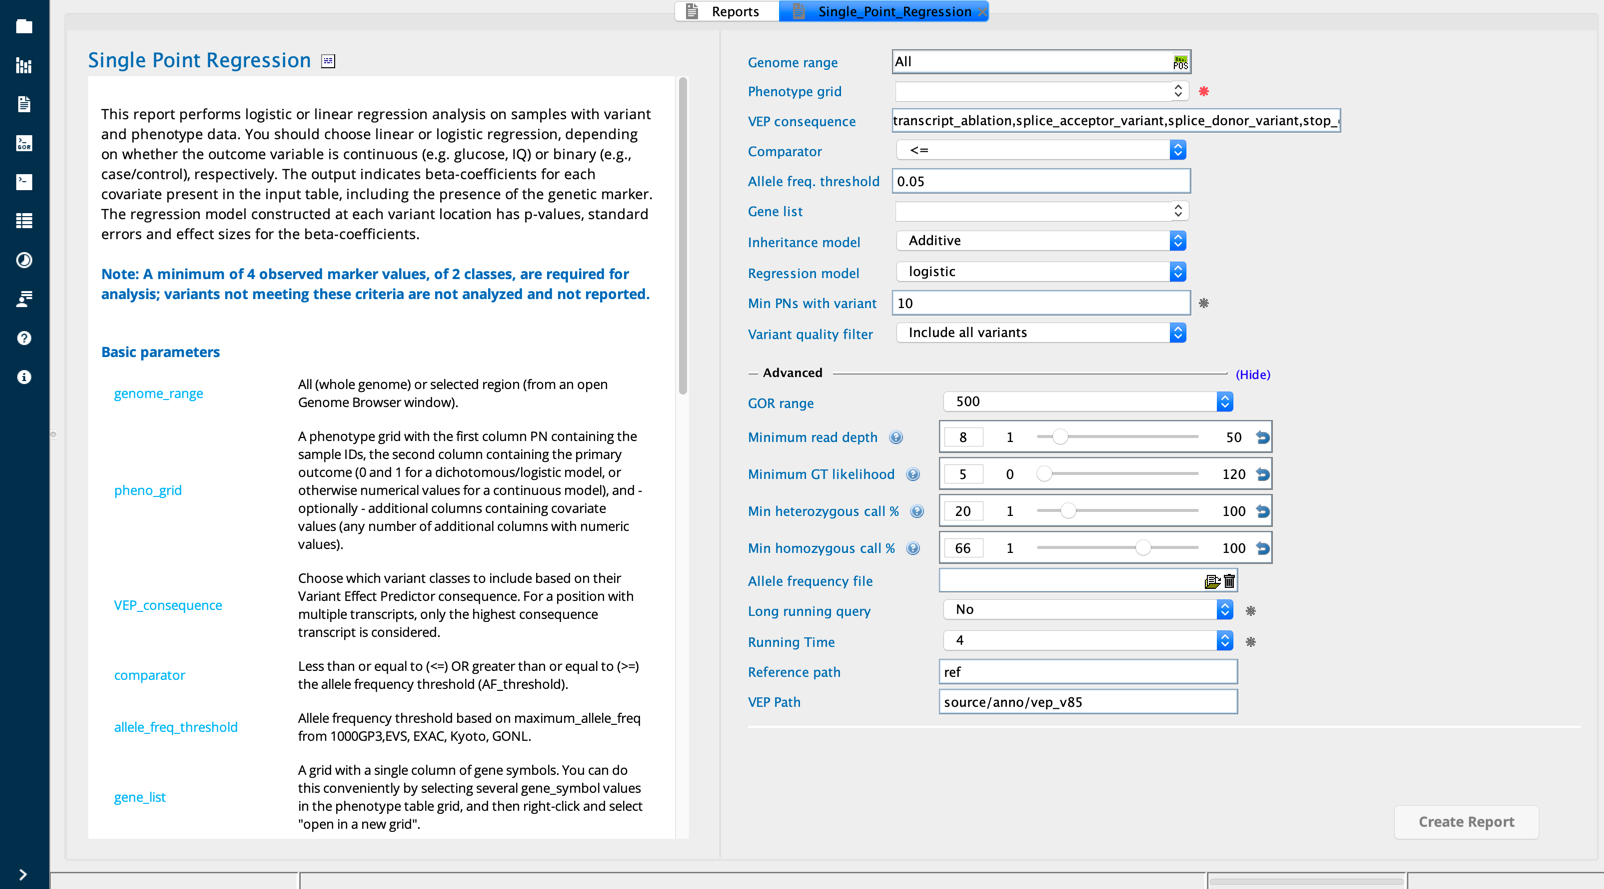
Single Point Regression module in Sequence Miner
Example use case
Linear regression
The user has conducted a genome-wide screen for sequence variants in patients with high blood pressure (each sequence variant is a marker). The user also has data on continuous and dichotomous explanatory variables: bmi, parent_bmi, and sex, and wishes to determine the effect size of each explanatory variable on high blood pressure, the response variable, in the context of each sequence variant.
Logistic regression
In the case of logistic regression, the user has genome-wide sequence variants along with dichotomous outcome data for responses to a drug (each sequence variant is a marker). The user also has data on continuous and dichotomous predictors (explanatory variables): smoker/nonsmoker, age, metabolite_blood_level, and wishes to determine the effect size of each explanatory variable on response/nonresponse to the drug, a binary response variable, in the context of each sequence variant.
Description of the algorithm
In the case of the linear regression model, the algorithm finds the linear coefficients (the beta coefficient) that give the optimal linear combination of all of the explanatory variables. The effect size and other statistical measures are determined for each explanatory variable based on the linear regression.
The logistic regression is similar except that the response variable (the outcome, e.g., response/nonresponse) is a dichotomous value.
For linear regression, effect size is the same as coeff (the Beta coefficient). For logistic regression, the effect size is eBeta.
Interpreting the output
For each variant, the analysis is performed for each covariate (the name column) so one row is returned for each sequence variant-covariate combination:

Considerations for interpreting the output:
The user may first sort the p-value column to view those covariates with the most statistically significant correlation to the outcome.
Next, these p-values are evaluated against the alpha column, which contains the Bonferroni-corrected statistical significance threshold (e.g., based on a statistical significance threshold of 0.05):
alpha = 0.05 / (total # of markers)
P-values less than alpha indicate statistical significance of the covariate to the outcome.
Covariates that meet this criteria are further evaluated based on the effectSize, which reflects the contribution of each covariate to the outcome.
The GOF (goodness of fit value) reflects the effectSize of the whole model: the combined contributions of the covariates plus the variant to the outcome.
NOTE on missing data:
All cells for which there is no available data should contain “NA” (without quotation marks).
In the case that a sample variant position has insufficient coverage ( < 8X coverage), that variant is designated as “NA”.
In order for a variant to be included in the analysis, > 2 samples (with > 8X coverage) must be homozygous for the reference allele and > 2 samples (with > 8X coverage) must carry at least one variant allele. Otherwise the marker (variant) is reported as “NA”.
Covariates with invariant data (a data column that contains only one unique value) will not be included in the analysis and will be reported as “NA”.
Samples with missing data (“NA”) for a covariate will not be included in the analysis of that covariate for any sequence variant.
Column descriptions
Column |
Description |
|---|---|
Chrom |
The chromosome of the variant represented as chr1, chr2, …, chr22, chrXY, chrX, chrY, chrM |
Pos |
The (first) base pair position of the sequence variant, e.g., the position of the first nucleotide in the Reference column |
Reference |
A sequence from the reference build, the first base starting at the base pair position in the Pos column |
Call |
“missing” indicates that this rsID-related variant is not present in the selected sample |
Gene_Symbol |
A unique identifier for the gene where this variant was found; a single variant may be found on many genes |
GOF |
Goodness of fit of the model for given set of covariates (correlation value from 0-1, where 1 is the best fit); in the case of logistic regression, McFadden R2; if linear regression, standard R2 |
name |
Names of all explanatory variables (x) in the regression model |
coeff |
Beta coefficient is the standardized weight of the predictor in the model (higher the value, the greater the contribution to the model); Beta coefficient (Beta coefficient and effectSize are the same for linear regression) |
stdError |
Standard error to measure the precision of the estimate of the Beta coefficient (σ2/√N, where N = sample size) |
stdScore |
Standard score is the Z-score (the number of standard deviations away from the mean of the sample distribution: Beta coeff / stderror) |
pValue |
The p-value (the probability of obtaining a result at least as extreme as the observed result) |
effectSize |
|
alpha |
Bonferroni corrected significance level |
Firth |
Bias correction statistic for data separation |