Sharing
The Sharing query calculates the relatedness between samples by calculating the relative fraction of shared rare SNP alleles.
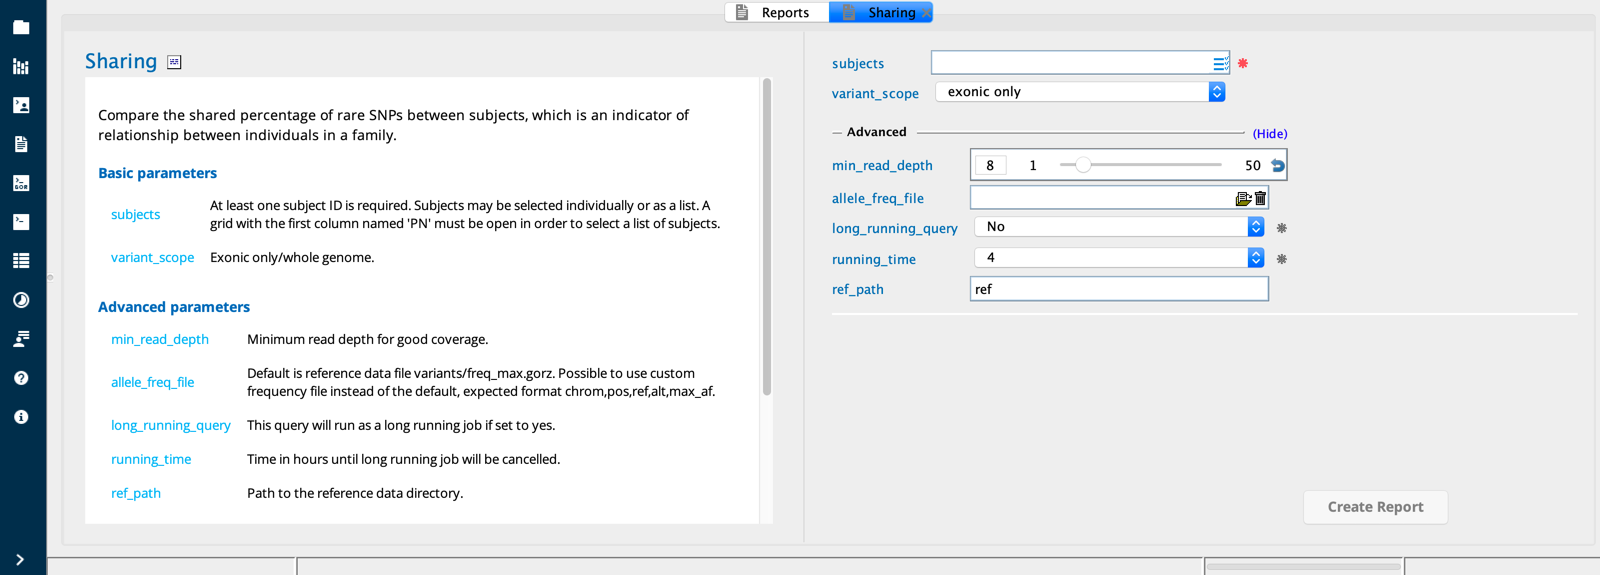
Sharing module in Sequence Miner
Example use case
This analysis tool expects germline WES/WGS data as input.
Using the report builder
Select the set of individuals to compare and whether you want the analysis to be limited to the exome. You can also specify a minimum threshold for coverage in order for variants to be considered in the analysis.
The output returns the average fraction of SNPs found in common between each pair of samples. Two samples returns one output row, three samples returns three output rows, four samples returns six output rows, etc.
Description of the algorithm
Identification of rare variants
The Sharing report builder measures sharing of rare alleles to estimate the degree of relatedness between selected samples. The query first generates a list of rare variants with minor allele frequency between 0.00001 and 0.05 according to the ref/freq_max.gorz file. The allele frequencies in this file are derived from the maximum of several population allele frequency databases, for example, gnomAD, ExAC, 1000 Genomes, and others.
Selection of rare variants from the subjects
A list of variants in the input list of subjects is identified that a) pass a quality filter and b) are present in the rare variants table created above.
Pairwise comparison between subjects, for each variant
Each variant is checked for presence in all subjects, and each variant site is checked for good coverage (defined by the input argument min_read_depth) in each subject. For each pair of subjects, a total count is calculated for a) how many times a variant is present in both subjects and b) how many times a variant site has good coverage in both subjects. These counts yeild the calculation of the PN1_SNPsUsed column.
Intrepreting the output
Relationship column
The relationship column shows the relationship between subjects you selected, either unrelated, half sibling, full sibling, or identical twins. The sharing column shows the ratio of shared rare SNPs in total rare variants in one of the samples. The sharing value is directly proportional to the degree of relatedness between the pair of subjects:
sharing > 0.9: relationship = IdenticalTwins
sharing between 0.4 - 0.6: relationship = FullSibs/ParentChild
sharing between 0.2 - 0.3: relationship = HalfSibs/GrandParents
sharing < 0.2: relationship = unrelated
For sharing values outside of these ranges: relationship = undetermined
Status
Because each pairwise comparison is done twice, once using one subject as the reference and again using the other subject as the reference, minimum, maximum, and average sharing values are calculated. Status (“ok” or “bad”) is based on the following test:
(minimum - average) / average < 0.1 → status is “ok”
(minimum - average) / average > 0.1 → status is “bad”
Note
minimum or maximum can be used in this test because (minimum - average) = (maximum - average)
Column descriptions
Column |
Description |
|---|---|
coeff_variation |
(PN1_sharing - avg_sharing)/avg_sharing |
PN1_SNPsUsed |
The number of rare, high-quality SNPS identified in PN1 |
PN1vsPN2 |
The samples (subjectIDs) being compared |
PN2_SNPsUsed |
The number of rare, high-quality SNPS identified in PN2 |
relationship |
|
Sharing |
|
status |
Indicator of quality based on an arbitrary threshold; if coeff_variation < 0.1, this value is “ok”, otherwise this indicator is “bad” |