Gene ontology association
The Gene ontology association report builder calculates the statistical significance of the degree of association between Gene Ontology (GO) database annotations for a list of genes of interest and categories in the GO database. Genes of interest may include, for instance:
Genes identified by a case-control variant association test
Genes identified by a case-control gene association test
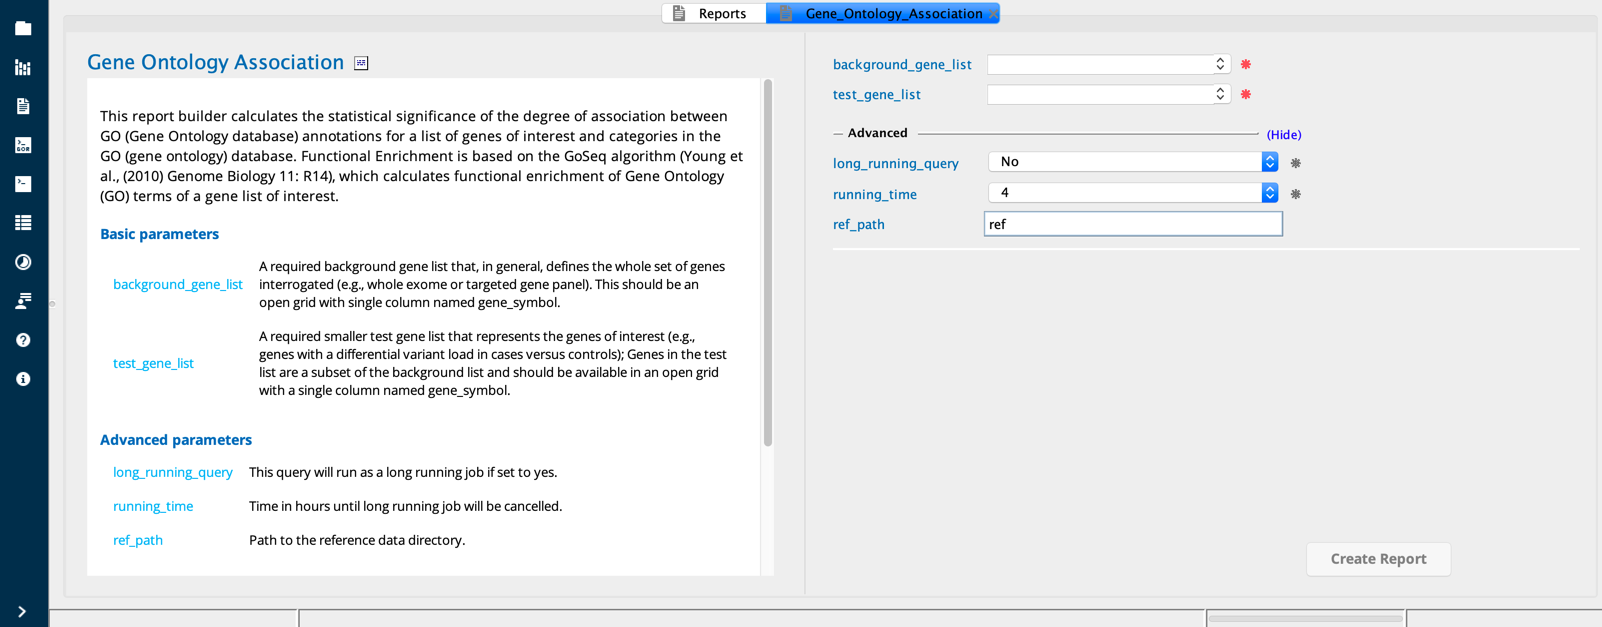
Gene Ontology Association module in Sequence Miner
Example use case
The user wishes to identify functional annotation terms for genes identified in a variant association study of cardiomyopathy. The user first conducts a genome-wide Variant association analysis to identify genes carrying more variants in cases compared to controls. After selecting the genes of interest based on a threshold statistical significance score (e.g., a nominal Fisher’s exact test pvalue threshold of < 0.05), the user saves this list as a grid and then selects it in the TestGeneList field.
The user then creates a BackgroundGeneList grid from the entire list of genes queried in the Variant association analysis (e.g., the cardiomyopathy gene panel), and selects this grid in the BackgroundGeneList field.
Description of the algorithm
The GO database is comprised of three ontologies:
Biological processes (BP)
Cellular components (CC)
Molecular functions (MF)
Each ontology is based on a layered and highly structured shared vocabulary describing GO categories.
The user provides a list of genes of interest (the TestGeneList grid) as well as a BackgroundGeneList grid. A BackgroundGeneList grid may include the genes with no variants that meet the threshold statistical significance score.
GO annotations for genes of interest are extracted from the Ensembl database. The levels of annotation for a given gene are dependent on the depth of knowledge about that gene. Given a set of GO-annotated genes of interest, GOseq calculates the probability (a Wallenius hypergeometric test p-value) for the observed degree of over-representation of each GO annotation term (across all GO categories) describing the genes of interest.
Interpreting the output
The output displays GO annotation terms with the corresponding p-values. Sort the output by p-value and focus on terms with the lowest p-values to identify candidates for further analysis.
Column descriptions
Column |
Description |
|---|---|
chrom |
|
CorrectedGOPvalue |
Adjusted (Benjamini,Hochberg) p value |
gene_start |
|
GOAccession |
GO Id |
GOClass |
The class of the nested GO term - BP, MF, or CC |
GOListHitsGeneIDs |
List of genes mapped to that GO term |
GOPvalue |
P value |
GOTerm |
GO Term definition |
ListHits |
Number of differentially mutated genes for that GO term (GOseq Node) |
ListSize |
Number of differentially mutated for the corresponding process class - BP, MF, or CC |
PopHits |
Total number of background genes with that GO Term (Goseq node). |
PopSize |
Total number of background genes with the corresponding GOseq process class - BP, MF, or CC |