Gene coverage
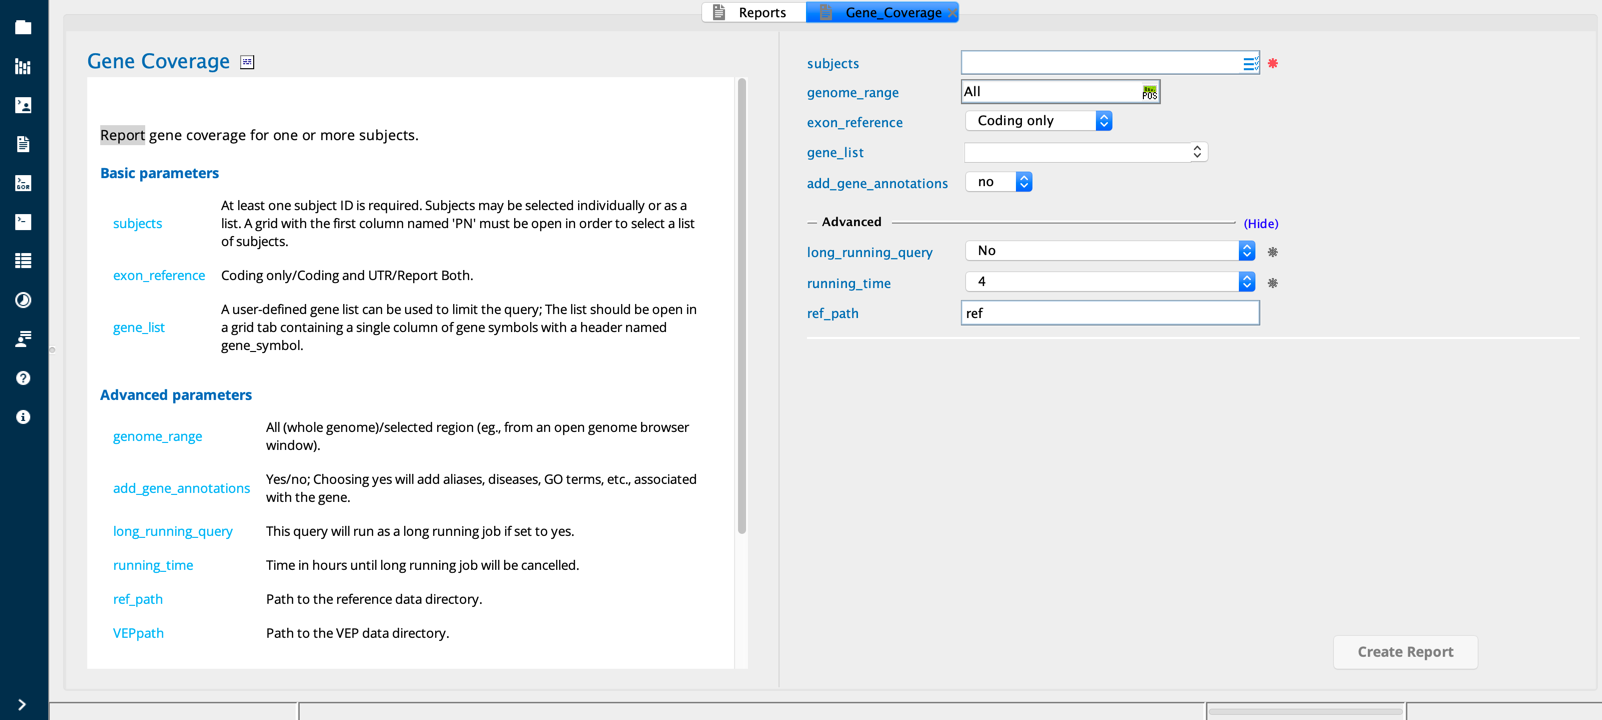
Gene Coverage module in Sequence Miner
Example use case
The Gene coverage report builder performs a sequence read coverage analysis. This analysis can be used as a quality control (QC) check for a set of samples, typically either across all genetic regions or for a specific list of genes. One or more subjects can be selected; results will be reported separately for each subject.
Description of the algorithm
Genes are defined by the Ensembl reference gene set. For the current Ensembl version, see the Version information link in CSA.
This report builder extracts coverage data for each subject (PN) from one of the following coverage files in the source/cov folder located in the project repository:
gene_cov_coding_seg.gord- for “Coding only”
gene_cov_all_seg.gord- for “Coding and UTR”
gene_cov_coding_seg.gordandgene_cov_all_seg.gord- for “Report both”
These files are used to calculate the average, maximum, and minimum sequence coverage of the reference set of genes for the selected samples.
The following gene annotations may be included as an additional option:
GO descriptions and IDs
OMIM descriptions and IDs
dbSourceMaxClinicalImpact (pathogenicity of a given gene as annotated by ClinVar, HGMD, and OMIM)
diseases (reported diseases with which the gene is associated as annotated by ClinVar, HGMD, and OMIM)
Interpreting the output
Each row of output lists attributes and quality statistics for each gene of interest in a single subject (PN). In each row, the total size of the exons covering the gene is reported in the exomeSize column followed by the average depth across the gene for the indicated PN.
The metrics used to flag regions of low coverage are lt5, lt10, lt15, lt20, lt25, and lt30. Each metric indicates a given coverage threshold, with a value between 0 and 1. For instance, a value of “0.05” for lt10 indicates that 5% of the gene is covered by fewer than 10 sequence reads, and therefore 95% of the gene has at least 10X coverage.
Additional columns are calculated for the gene across the set of selected samples. The avg_depth column for each sample for a given gene is compared to produce a minimum (“min_avg_depth”), maximum (“max_avg_depth”), and average (“avg_avg_depth”) depth value observed across the selected samples. These three values will be the same for all samples for a given gene.
Column descriptions
Group |
Column name |
Description |
|---|---|---|
Basic |
Chrom |
|
PN |
Subject ID |
|
avg |
avg_depth |
For a set of selected samples, the average read depth for the gene across the set of samples |
depth |
The average of the number of reads across the gene for the designated PN |
|
gene |
end |
Gene end position |
start |
Gene start position |
|
Symbol |
HGNC gene symbol |
|
Other columns |
exomeSize |
Number of bases of coding sequence or coding + UTR sequence (defined by the gene_end-gene_start) |
exontype |
“Coding” (Coding only) or “all” (Coding and UTR) |
|
lt10 |
The fraction of the exome with sequence read coverage less than 10X |
|
lt15 |
The fraction of the exome with sequence read coverage less than 15X |
|
lt20 |
The fraction of the exome with sequence read coverage less than 20X |
|
lt25 |
The fraction of the exome with sequence read coverage less than 25X |
|
lt30 |
The fraction of the exome with sequence read coverage less than 30X |
|
lt5 |
The fraction of the exome with sequence read coverage less than 5X |
|
max_avg_depth |
For a set of selected samples, the maximum average depth observed for the gene |
|
min_avg_depth |
For a set of selected samples, the minimum average depth observed for the gene |
Additional annotation columns
If the add_gene_annotations option is set to “yes”, the following annotation columns are added:
Group |
Column name |
Description |
|---|---|---|
gene |
Aliases |
List of gene aliases that correspond to the GENE_symbol |
Biotype |
Biological class of gene as annotated by Ensembl |
|
cdsEnd |
cDNA end position |
|
cdsStart |
cDNA start position |
|
Description |
Description of the gene, i.e. full gene name and gene name source (e.g., HGNC) |
|
diseases |
Diseases known to be associated with the gene as annotated by ClinVar, HGMD, and OMIM |
|
gene_stable_id |
Ensembl stable ID for the gene |
|
Paralogs |
The paralogs of the given gene as annotated by Ensembl |
|
Strand |
The strand of DNA (+/-) from which the gene is transcribed |
|
GO |
Descriptions |
Gene Ontology category descriptions |
IDs |
Gene Ontology identifiers |
|
lis |
dbSourceMaxClinImpact |
List of clinical impact database source (ClinVar, HGMD, and OMIM) |
disease |
List of the associated diseases annotated for the gene by ClinVar, HGMD, and OMIM |
|
OMIM |
Descriptions |
OMIM disease descriptions for the gene |
IDs |
The OMIM ID of the gene |
|
Other columns |
MaxClinImpact |
Max clinical impact annotated by ClinVar, HGMD, and OMIM |
set_Pathway |
Perspective views
If “Report both” is selected in the exon_reference field, the Coding only and Coding and UTR sequence information can be viewed in separate tables by selecting the Coding or AllExome perspectives, respectively.
Perspective |
Description |
|---|---|
AllExome |
Coding and UTR (if selected) |
Coding |
Coding only (if selected) |
Default View |
Results displayed based on initial selection (“Coding only”, “Coding and UTR”, or “Report both”) |